Lumber Liquidators 2009 Annual Report Download - page 28
Download and view the complete annual report
Please find page 28 of the 2009 Lumber Liquidators annual report below. You can navigate through the pages in the report by either clicking on the pages listed below, or by using the keyword search tool below to find specific information within the annual report.-
 1
1 -
2
-
3
-
4
-
5
-
6
-
7
-
8
-
9
-
10
-
11
-
12
-
13
-
14
-
15
-
16
-
17
-
 18
18 -
 19
19 -
 20
20 -
 21
21 -
 22
22 -
 23
23 -
 24
24 -
 25
25 -
 26
26 -
 27
27 -
 28
28 -
 29
29 -
 30
30 -
 31
31 -
 32
32 -
 33
33 -
 34
34 -
 35
35 -
 36
36 -
 37
37 -
 38
38 -
39
-
40
-
41
-
42
-
43
-
44
-
45
-
46
-
47
-
48
-
49
-
50
-
51
-
52
-
53
-
54
-
55
-
56
-
57
-
58
-
59
-
60
-
61
-
62
-
63
-
64
-
65
-
66
-
67
-
68
-
69
-
70
-
71
-
72
 |
 |

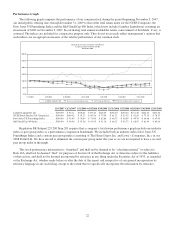
Performance Graph
The following graph compares the performance of our common stock during the period beginning November 9, 2007,
our initial public offering date, through December 31, 2009 to that of the total return index for the NYSE Composite, the
Dow Jones US Furnishings Index and the S&P SmallCap 600 Index (which now includes Lumber Liquidators) assuming an
investment of $100 on November 9, 2007. In calculating total annual stockholder return, reinvestment of dividends, if any, is
assumed. The indices are included for comparative purpose only. They do not necessarily reflect management’s opinion that
such indices are an appropriate measure of the relative performance of our common stock.
0.00
50.00
100.00
150.00
200.00
250.00
300.00
11/9/2007
Comparison of 2 Year Cumulative Total Return
Assumes Initial Investment of $100
December 2009
LUMBER LIQUIDATORS Dow Jones US Furnishings Index S&P Smallcap 600 Index NYSE Stock Market (US Companies)
10/31/20096/30/20092/28/200910/31/20086/30/20082/29/2008
11/9/2007 12/31/2007 3/31/2008 6/30/2008 9/30/2008 12/31/2008 3/31/2009 6/30/2009 9/30/2009 12/31/2009
Lumber Liquidators, Inc .............. $100.00 $ 92.11 $108.61 $133.20 $128.69 $108.20 $130.64 $161.48 $222.24 $274.60
NYSE Stock Market (US Companies) .... $100.00 $100.42 $ 91.27 $ 90.58 $ 79.30 $ 61.11 $ 53.32 $ 63.83 $ 75.13 $ 78.57
Dow Jones US Furnishings Index ....... $100.00 $ 95.99 $ 78.99 $ 73.00 $ 82.86 $ 48.75 $ 38.09 $ 49.70 $ 64.48 $ 67.93
S&P SmallCap 600 Index ............. $100.00 $ 98.96 $ 91.58 $ 91.95 $ 91.16 $ 68.21 $ 56.72 $ 68.67 $ 81.49 $ 85.66
Regulation SK-Subpart 229.200 Item 201 requires that a company’s total return performance graph include one industry
index or peer group index as a performance comparison benchmark. We included both an industry index (Dow Jones US
Furnishings Index) and a custom peer group index (consisting of The Home Depot, Inc. and Lowe’s Companies, Inc.) in our
2008 Form10-K. We have elected to eliminate the custom peer group index this year as we are not required to have a second
peer group index in the graph.
This stock performance information is “furnished” and shall not be deemed to be “soliciting material” or subject to
Rule 14A, shall not be deemed “filed” for purposes of Section 18 of the Exchange Act or otherwise subject to the liabilities
of that section, and shall not be deemed incorporated by reference in any filing under the Securities Act of 1933, as amended,
or the Exchange Act, whether made before or after the date of this report and irrespective of any general incorporation by
reference language in any such filing, except to the extent that we specifically incorporate the information by reference.
22