Lumber Liquidators 2009 Annual Report Download - page 51
Download and view the complete annual report
Please find page 51 of the 2009 Lumber Liquidators annual report below. You can navigate through the pages in the report by either clicking on the pages listed below, or by using the keyword search tool below to find specific information within the annual report.-
 1
1 -
2
-
3
-
4
-
5
-
6
-
7
-
8
-
9
-
10
-
11
-
12
-
13
-
14
-
15
-
16
-
17
-
18
-
19
-
20
-
21
-
22
-
23
-
24
-
25
-
26
-
27
-
28
-
29
-
30
-
31
-
32
-
33
-
34
-
35
-
36
-
37
-
38
-
39
-
40
-
 41
41 -
 42
42 -
 43
43 -
 44
44 -
 45
45 -
 46
46 -
 47
47 -
 48
48 -
 49
49 -
 50
50 -
 51
51 -
 52
52 -
 53
53 -
 54
54 -
 55
55 -
 56
56 -
 57
57 -
 58
58 -
 59
59 -
 60
60 -
 61
61 -
62
-
63
-
64
-
65
-
66
-
67
-
68
-
69
-
70
-
71
-
72
 |
 |

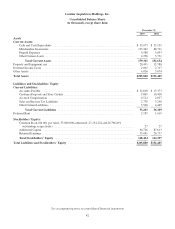
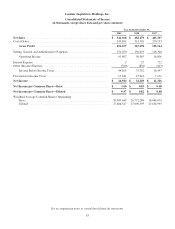
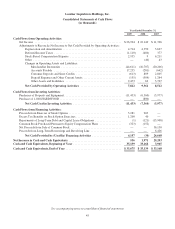
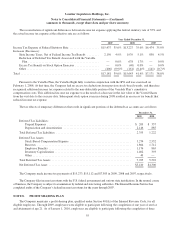
Lumber Liquidators Holdings, Inc.
Consolidated Statements of Cash Flows
(in thousands)
Year Ended December 31,
2009 2008 2007
Cash Flows from Operating Activities:
Net Income ........................................................... $26,924 $ 22,149 $ 11,326
Adjustments to Reconcile Net Income to Net Cash Provided by Operating Activities:
Depreciation and Amortization ........................................ 4,714 4,350 3,627
Deferred Income Taxes .............................................. (1,110) (486) 377
Stock-Based Compensation Expense ................................... 2,955 9 6,211
Other ............................................................ — (40) 43
Changes in Operating Assets and Liabilities:
Merchandise Inventories ......................................... (44,611) (16,707) (20,266)
Accounts Payable .............................................. 17,235 (281) (642)
Customer Deposits and Store Credits ............................... (613) 809 2,805
Prepaid Expenses and Other Current Assets .......................... (155) (504) 1,264
Other Assets and Liabilities ...................................... 2,473 62 3,767
Net Cash Provided by Operating Activities ............................ 7,812 9,361 8,512
Cash Flows from Investing Activities:
Purchases of Property and Equipment ....................................... (11,433) (6,560) (5,977)
Purchase of 1-800-HARDWOOD .......................................... — (800) —
Net Cash Used in Investing Activities ................................. (11,433) (7,360) (5,977)
Cash Flows from Financing Activities:
Proceeds from Exercise of Stock Options .................................... 3,281 203 —
Excess Tax Benefits on Stock Option Exercises ............................... 1,200 40 —
Repayments of Long-Term Debt and Capital Lease Obligations .................. (1) (121) (15,908)
Common Stock Purchased Pursuant to Equity Compensation Plans ............... (323) (152) —
Net Proceeds from Sale of Common Stock ................................... — — 36,150
Proceeds from Long-Term Borrowings and Revolving Line ..................... — — 6,426
Net Cash Provided by (Used In) Financing Activities .................... 4,157 (30) 26,668
Net Increase in Cash and Cash Equivalents .................................... 536 1,971 29,203
Cash and Cash Equivalents, Beginning of Year ................................. 35,139 33,168 3,965
Cash and Cash Equivalents, End of Year ...................................... $ 35,675 $ 35,139 $ 33,168
See accompanying notes to consolidated financial statements
45