Lumber Liquidators 2009 Annual Report Download - page 39
Download and view the complete annual report
Please find page 39 of the 2009 Lumber Liquidators annual report below. You can navigate through the pages in the report by either clicking on the pages listed below, or by using the keyword search tool below to find specific information within the annual report.-
 1
1 -
2
-
3
-
4
-
5
-
6
-
7
-
8
-
9
-
10
-
11
-
12
-
13
-
14
-
15
-
16
-
17
-
18
-
19
-
20
-
21
-
22
-
23
-
24
-
25
-
26
-
27
-
28
-
 29
29 -
 30
30 -
 31
31 -
 32
32 -
 33
33 -
 34
34 -
 35
35 -
 36
36 -
 37
37 -
 38
38 -
 39
39 -
 40
40 -
 41
41 -
 42
42 -
 43
43 -
 44
44 -
 45
45 -
 46
46 -
 47
47 -
 48
48 -
 49
49 -
50
-
51
-
52
-
53
-
54
-
55
-
56
-
57
-
58
-
59
-
60
-
61
-
62
-
63
-
64
-
65
-
66
-
67
-
68
-
69
-
70
-
71
-
72
 |
 |

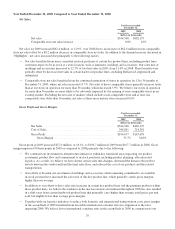
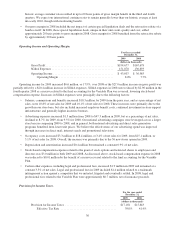
Operating income for 2008 increased $18.2 million, or 96.7%, over 2007 as the $32.6 million increase in gross profit
was partially offset by a $14.4 million increase in SG&A expenses. These increases in SG&A expenses were principally due
to the following factors:
• Salaries, commissions and benefits increased $8.6 million for 2008 from the prior year. This increase was primarily
due to the growth in our store base and related warehouse operations, but also reflects salaries, commissions and
benefits related to our executive and operational infrastructure investment, which we completed in the first quarter
of 2008. As a percentage of net sales, salaries, commissions and benefits were 10.1% of net sales for 2008 and
9.9% of net sales for 2007. This increase as a percentage of net sales was primarily the result of increases in
employee benefit costs and additional corporate store support infrastructure.
• Advertising expenses increased $4.1 million to $45.8 million, or 9.5% of net sales for 2008, from $41.7 million, or
10.3% of net sales for 2007. As a percentage of net sales, our national advertising campaigns were leveraged across
a larger store base in comparing 2008 to 2007. This leverage was partially offset by an increase in the advertising
spend for direct sales generation and local advertising programs, including direct mail, certain radio and newspaper
advertisements, and trade shows. In addition, the weakening economy in fourth quarter of 2008 resulted in reduced
marketing costs, including internet search.
• Occupancy costs increased $2.3 million to $15.1 million, or 3.1% of net sales for 2008, from $12.7 million, or
3.1% of net sales for 2007. Overall increases in 2008 were primarily due to store base growth, but also reflected the
enhanced visibility of our newer locations, which have generally resulted in an increase in the per-location
occupancy costs relative to the typical historic store. These increases were generally offset by the sales growth of
maturing stores.
• Stock-based compensation expense was $0.01 million in 2008, as compared to $6.2 million in 2007. Stock-based
compensation expense included:
OStock Options and Restricted Stock: expense of $3.0 million in 2008 and 2007. The 2007 amount included
$1.2 million of accelerated vesting of certain stock options and initial recognition of certain stock units
triggered by the IPO.
OVariable Plan: expense reduction of $2.96 million in the fourth quarter 2008 as a reserve was reversed upon
the receipt of a final arbitration ruling. There were no other Variable Plan stock-based compensation expenses
in 2008. Expense of $3.2 million in 2007, which included the fourth quarter accrual of the $2.96 million
reserve.
• Depreciation and amortization increased $0.7 million but remained a constant 0.9% of net sales.
• Certain other expenses, including legal and professional fees, increased $4.9 million in 2008, and as a percentage
of net sales, increased to 3.5% for 2008, from 3.0% for 2007. This increase as a percentage of net sales was
primarily due to expenses related to operating as a public company, including certain insurance costs. In addition,
legal and professional fees related to the Variable Plan were approximately $0.7 million, net of insurance proceeds.
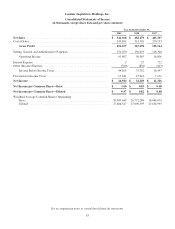
Provision for Income Taxes.
For the year ended
December 31,
2008 2007
(dollars in thousands)
Provision for Income Taxes .................................... $15,643 $7,171
Effective Tax Rate ....................................... 41.4% 38.8%
The effective tax rate increased to 41.4% for 2008 and included a first quarter charge of $0.7 million for nondeductible
deferred taxes related to the Variable Plan, and an increase in state income taxes, partially offset by increases in tax-exempt
interest income and excess tax benefits on stock option exercises.
33