Lumber Liquidators 2009 Annual Report Download - page 38
Download and view the complete annual report
Please find page 38 of the 2009 Lumber Liquidators annual report below. You can navigate through the pages in the report by either clicking on the pages listed below, or by using the keyword search tool below to find specific information within the annual report.-
 1
1 -
2
-
3
-
4
-
5
-
6
-
7
-
8
-
9
-
10
-
11
-
12
-
13
-
14
-
15
-
16
-
17
-
18
-
19
-
20
-
21
-
22
-
23
-
24
-
25
-
26
-
27
-
 28
28 -
 29
29 -
 30
30 -
 31
31 -
 32
32 -
 33
33 -
 34
34 -
 35
35 -
 36
36 -
 37
37 -
 38
38 -
 39
39 -
 40
40 -
 41
41 -
 42
42 -
 43
43 -
 44
44 -
 45
45 -
 46
46 -
 47
47 -
 48
48 -
49
-
50
-
51
-
52
-
53
-
54
-
55
-
56
-
57
-
58
-
59
-
60
-
61
-
62
-
63
-
64
-
65
-
66
-
67
-
68
-
69
-
70
-
71
-
72
 |
 |

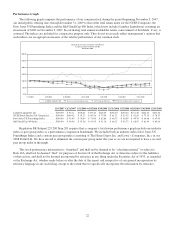
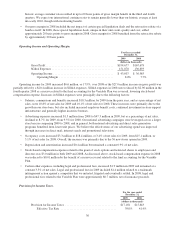
Gross Profit and Gross Margin.
For the year ended
December 31,
2008 2007
(dollars in thousands)
Net Sales ................................................ $482,179 $405,307
Cost of Sales ............................................. 314,501 270,193
Gross Profit .............................................. $167,678 $135,114
Gross Margin ........................................ 34.8% 33.3%
Gross profit in 2008 increased $32.6 million, or 24.1%, to $167.7 million in 2008 from $135.1 million in 2007. Gross
margin improved 150 basis points in 2008 as compared to 2007 primarily due to:
• The introduction of certain premium products in key product lines began late in the second quarter of 2007. We
broadened those offerings and increased inventory levels throughout the second half of 2007 and 2008. Those
premium products typically carry a higher than average gross margin and gained significant sales strength in
comparing 2008 to 2007.
• Moldings and accessories carry a higher than average gross margin and the sales mix of these products increased in
2008 as compared to 2007.
• Expenses related to domestic and international transportation generally increased in comparing 2008 to 2007.
Rising fuel costs generally increased the average cost of an inbound international container and the average
per-mile ground charge. These fuel costs, which had significantly risen in 2008, declined sharply in the fourth
quarter. As a component of the product unit cost, however, the gross margin impact of a change in fuel costs tends
to lag by 60 to 120 days. In addition, a number of logistics initiatives were implemented to reduce the miles driven
by trucks supplying merchandise inventories to our stores. These initiatives began in the third and fourth quarter of
2007 and continued throughout 2008.
• Liquidation deals favorably impacted 2008 gross margin in three ways:
OIn the second quarter of 2008, we strengthened our merchandising staff to enhance our focus on the entire
product cycle of liquidation deals, an important component of both our product assortment and our
promotional marketing campaigns.
OCertain special higher than average quality and unit count liquidation deals were available throughout 2008,
but particularly in the first and second quarters. We estimate that these special buys benefited gross margin by
approximately 10 to 15 basis points in comparing 2008 to the prior year.
OThe promotional opportunities surrounding these special liquidation deals generated incremental consumer
traffic, a certain portion of which we believe converted to our proprietary products, particularly our laminates,
contributing up to approximately 7 to 8 basis points to the improvement in our gross margin for the year.
• A tariff on certain bamboo products was reduced in the second quarter of 2008. The tariff was originally
implemented in the second quarter of 2007 and was rebated retroactively on an individual entry basis. Gross
margin for 2008 benefited from the retroactive rebate by approximately 20 basis points. We completed the rebate
process in the third quarter of 2008.
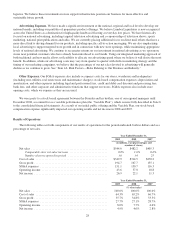
Operating Income and Operating Margin.
For the year ended
December 31,
2008 2007
(dollars in thousands)
Gross Profit .............................................. $167,678 $135,114
SG&A Expenses .......................................... 130,693 116,308
Operating Income ......................................... $ 36,985 $ 18,806
Operating Margin ..................................... 7.7% 4.6%
32