Lumber Liquidators 2009 Annual Report Download - page 31
Download and view the complete annual report
Please find page 31 of the 2009 Lumber Liquidators annual report below. You can navigate through the pages in the report by either clicking on the pages listed below, or by using the keyword search tool below to find specific information within the annual report.-
 1
1 -
2
-
3
-
4
-
5
-
6
-
7
-
8
-
9
-
10
-
11
-
12
-
13
-
14
-
15
-
16
-
17
-
18
-
19
-
20
-
 21
21 -
 22
22 -
 23
23 -
 24
24 -
 25
25 -
 26
26 -
 27
27 -
 28
28 -
 29
29 -
 30
30 -
 31
31 -
 32
32 -
 33
33 -
 34
34 -
 35
35 -
 36
36 -
 37
37 -
 38
38 -
 39
39 -
 40
40 -
 41
41 -
42
-
43
-
44
-
45
-
46
-
47
-
48
-
49
-
50
-
51
-
52
-
53
-
54
-
55
-
56
-
57
-
58
-
59
-
60
-
61
-
62
-
63
-
64
-
65
-
66
-
67
-
68
-
69
-
70
-
71
-
72
 |
 |

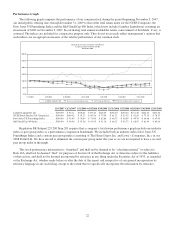
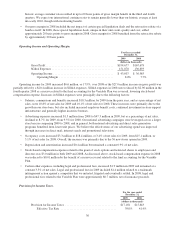
to our stores and the cost of delivering product purchases to the customer. Our gross margin has expanded since the latter
half of 2007 due primarily to our infrastructure investments.
Labor costs and advertising expenses have historically been our most significant operating expenses. Our in-store labor
costs have increased primarily as a result of our store base growth, and together with our infrastructure investments, total
labor costs have increased as a percentage of net sales. Our annual advertising costs have increased as we continue to support
our brand and implement direct sales generation programs in support of our growth, but we continue to leverage those
expenses across a larger store base. Overall, we expect operating margins to expand as we continue to grow our store base
and our comparable store net sales increase.
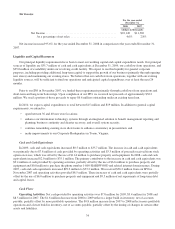
We completed our initial public offering in November 2007. We reorganized effective December 31, 2009, creating a
new holding company structure, and as a result, a new parent company named Lumber Liquidators Holdings, Inc. was
formed. Outstanding shares of the common stock of the former parent company, which was named Lumber Liquidators, Inc.,
were automatically converted, on a share for share basis, into identical shares of common stock of the new holding company.
2009 Highlights
Sales Volume and Consumer Traffic Increases.In 2009, net sales increased $62.4 million, or 12.9% from 2008, driven
by increases in our total sales volume, primarily measured in square footage. In both comparable stores, where net sales were
unchanged comparing 2009 to 2008, and non-comparable stores, consumer demand continued to shift our mix of products
sold, or sales mix, to certain key product lines which generally have a lower than average retail price. As a result, in
comparing 2009 to 2008, our average retail price per unit sold decreased approximately 10.5%, and our average sale
decreased approximately 11.0%, to $1,560. Applying our 2009 average sale to total net sales implies a total increase in the
number of customers invoiced of 26.9%, and at comparable stores, an increase of 12.4%.
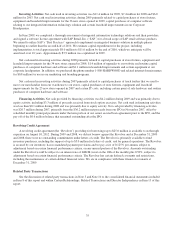
Gross Margin Expansion.Gross margin expanded to 35.7% for 2009, continuing to benefit from changes in our
product line sales mix, as well as our effective execution of initiatives in store operations, merchandising and logistics.
Though customer demand continued to shift towards product lines that generally carry a lower than average retail price point,
customers continued to prefer the premium products within those product lines. In 2008, gross margin was 34.8% and
included approximately 40 basis points of benefit related to certain special liquidation deals and a retroactive rebate of a
bamboo tariff.
Merchandise Inventories Investment. Merchandise inventories at December 31, 2009 increased $44.6 million from
December 31, 2008, as available for sale inventory increased $33.8 million and inbound in-transit inventory increased $10.8
million. We consider merchandise inventories either “available for sale” or “inbound in-transit,” based on whether we have
physically received the products at our central distribution center in Toano, Virginia, at an individual store location, or in
another facility where we control and monitor inspection, including the China consolidation center. The increase in both
available for sale inventory and inbound in-transit inventory resulted from two primary factors, a planned build in
preparation for the annual interruption in merchandise flow from Asia due to the Chinese New Year and the launch of a new
merchandise inventories initiative.
In the fourth quarter of 2009, we launched an initiative to strengthen our in-stock commitment to our top selling
products by region across all product lines. The products selected have generally represented our top selling products over a
longer period of time, significantly reducing the risk of obsolescence. Our strengthening of in-stock positions at the store
level guarantees a certain level of inventory available for future sales orders. We believe this further enhances our value
proposition, and we expect to have this program fully in place by the end of the first quarter of 2010.
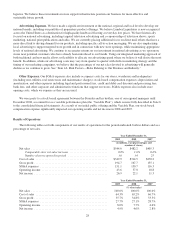
Merchandise inventories and available inventory per store in operation on December 31 were as follows:
2009 2008 2007
(in thousands)
Inventory—Available for Sale ........................... $109,369 $75,521 $60,273
Inventory—Inbound In-Transit ........................... 23,973 13,210 11,751
Total Merchandise Inventories ......................... $133,342 $88,731 $72,024
Available Inventory Per Store .......................... $ 588 $ 503 $ 520
25