Lumber Liquidators 2009 Annual Report Download - page 34
Download and view the complete annual report
Please find page 34 of the 2009 Lumber Liquidators annual report below. You can navigate through the pages in the report by either clicking on the pages listed below, or by using the keyword search tool below to find specific information within the annual report.-
 1
1 -
2
-
3
-
4
-
5
-
6
-
7
-
8
-
9
-
10
-
11
-
12
-
13
-
14
-
15
-
16
-
17
-
18
-
19
-
20
-
21
-
22
-
23
-
 24
24 -
 25
25 -
 26
26 -
 27
27 -
 28
28 -
 29
29 -
 30
30 -
 31
31 -
 32
32 -
 33
33 -
 34
34 -
 35
35 -
 36
36 -
 37
37 -
 38
38 -
 39
39 -
 40
40 -
 41
41 -
 42
42 -
 43
43 -
 44
44 -
45
-
46
-
47
-
48
-
49
-
50
-
51
-
52
-
53
-
54
-
55
-
56
-
57
-
58
-
59
-
60
-
61
-
62
-
63
-
64
-
65
-
66
-
67
-
68
-
69
-
70
-
71
-
72
 |
 |

logistics. We believe these investments in store support infrastructure position our business for more effective and
sustainable future growth.
Advertising Expenses. We have made a significant investment at the national, regional and local level to develop our
national brands, including our portfolio of proprietary product offerings. We believe Lumber Liquidators is now recognized
across the United States as a destination for high-quality hardwood flooring at everyday low prices. We have historically
focused on national advertising, including targeted television advertising and co-sponsorship of television shows, sports
marketing, national print publications and radio. We are currently placing additional focus on direct mail efforts that have a
more direct link to driving demand for our products, including specific call-to-action messaging. We are also emphasizing
local advertising to support targeted store growth and in connection with new store openings, while maintaining appropriate
levels of national advertising. We continue to see greater returns on our investment in national advertising as we open more
stores near potential customers who have already been introduced to our brands. Using our integrated marketing approach of
both traditional and new media allows us flexibility to allocate our advertising spend where we believe it will derive the most
benefit. In addition, while our advertising costs may vary from quarter to quarter with shifts in marketing strategy and the
timing of our marketing campaigns, we believe that the percentage of our net sales devoted to advertising will generally
decline as we continue to grow. See “Item 1A. Risk Factors—Risks Relating to Our Business and Industry.”
Other Expenses. Our SG&A expenses also include occupancy costs for our stores, warehouse and headquarters
(including rent, utilities, real estate taxes and maintenance charges); stock-based compensation expenses; depreciation and
amortization; and other expenses including legal and professional fees, credit and debit card discount and processing fees,
bank fees, and other corporate and administrative functions that support our stores. SG&A expenses also include store
opening costs, which we expense as they are incurred.
We were party to a stock-based agreement between the Founder and his brother, one of our regional managers until
December 2008, accounted for as a variable performance plan (the “Variable Plan”), which is more fully described in Note 6
to the consolidated financial statements. As a result of our initial public offering and the Variable Plan, our stock-based
compensation expense significantly impacted our operating results and net income in 2008 and 2007.
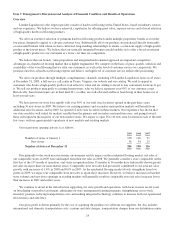
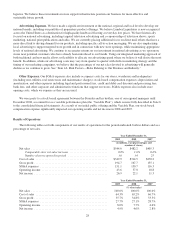
Results of Operations
The following tables set forth components of our results of operations for the periods indicated, both in dollars and as a
percentage of net sales.
Year Ended December 31,
2009 2008 2007
(in millions, except percentages and
number of stores)
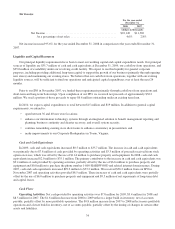
Net sales .................................................... $544.6 $482.2 $405.3
Comparable store net sales increase .......................... 0.0% 1.6% 8.6%
Number of stores opened in period ........................... 36 34 25
Cost of sales ................................................. $349.9 $314.5 $270.2
Gross profit .................................................. 194.7 167.7 135.1
SG&A expenses .............................................. 151.1 130.7 116.3
Operating income ............................................. 43.6 37.0 18.8
Net income .................................................. 26.9 22.1 11.3
Year Ended December 31,
2009 2008 2007
(% of net sales)
Net sales .................................................... 100.0% 100.0% 100.0%
Cost of sales ................................................. 64.3% 65.2% 66.7%
Gross profit .................................................. 35.7% 34.8% 33.3%
SG&A expenses .............................................. 27.7% 27.1% 28.7%
Operating income ............................................. 8.0% 7.7% 4.6%
Net income .................................................. 4.9% 4.6% 2.8%
28