Lumber Liquidators 2009 Annual Report Download - page 50
Download and view the complete annual report
Please find page 50 of the 2009 Lumber Liquidators annual report below. You can navigate through the pages in the report by either clicking on the pages listed below, or by using the keyword search tool below to find specific information within the annual report.-
 1
1 -
2
-
3
-
4
-
5
-
6
-
7
-
8
-
9
-
10
-
11
-
12
-
13
-
14
-
15
-
16
-
17
-
18
-
19
-
20
-
21
-
22
-
23
-
24
-
25
-
26
-
27
-
28
-
29
-
30
-
31
-
32
-
33
-
34
-
35
-
36
-
37
-
38
-
39
-
 40
40 -
 41
41 -
 42
42 -
 43
43 -
 44
44 -
 45
45 -
 46
46 -
 47
47 -
 48
48 -
 49
49 -
 50
50 -
 51
51 -
 52
52 -
 53
53 -
 54
54 -
 55
55 -
 56
56 -
 57
57 -
 58
58 -
 59
59 -
 60
60 -
61
-
62
-
63
-
64
-
65
-
66
-
67
-
68
-
69
-
70
-
71
-
72
 |
 |

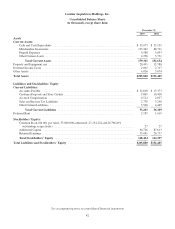
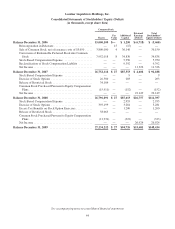
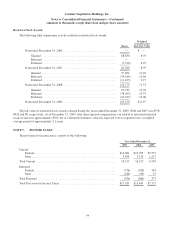
Lumber Liquidators Holdings, Inc.
Consolidated Statements of Stockholders’ Equity (Deficit)
(in thousands, except share data)
Common Stock
Shares
Par
Value
Additional
Capital
Retained
Earnings
(Deficit)
Total
Stockholders’
Equity (Deficit)
Balance December 31, 2006 ............................. 15,000,100 $— $ 1,250 $ (6,718) $ (5,468)
Reincorporation in Delaware .......................... — 15 (15) — —
Sale of Common Stock, net of issuance costs of $5,650 ..... 3,800,000 4 36,146 — 36,150
Conversion of Redeemable Preferred Stock into Common
Stock .......................................... 7,952,018 8 34,830 — 34,838
Stock-Based Compensation Expense ................... — — 5,950 — 5,950
Reclassification of Stock Compensation Liability ......... — — 9,392 — 9,392
Net Income ........................................ — — — 11,326 11,326
Balance December 31, 2007 ............................. 26,752,118 $ 27 $87,553 $ 4,608 $ 92,188
Stock-Based Compensation Expense ................... — — 9 — 9
Exercise of Stock Options ............................ 26,500 — 203 — 203
Release of Restricted Stock ........................... 34,184 — — — —
Common Stock Purchased Pursuant to Equity Compensation
Plans ........................................... (15,911) — (152) — (152)
Net Income ........................................ — — — 22,149 22,149
Balance December 31, 2008 ............................. 26,796,891 $ 27 $87,613 $26,757 $114,397
Stock-Based Compensation Expense ................... — — 2,955 — 2,955
Exercise of Stock Options ............................ 393,199 — 3,281 — 3,281
Excess Tax Benefits on Stock Option Exercises ........... — — 1,200 — 1,200
Release of Restricted Stock ........................... 58,063 — — — —
Common Stock Purchased Pursuant to Equity Compensation
Plans ........................................... (13,931) — (323) — (323)
Net Income ........................................ — — — 26,924 26,924
Balance December 31, 2009 ............................. 27,234,222 $ 27 $94,726 $53,681 $148,434
See accompanying notes to consolidated financial statements
44