Lumber Liquidators 2009 Annual Report Download - page 35
Download and view the complete annual report
Please find page 35 of the 2009 Lumber Liquidators annual report below. You can navigate through the pages in the report by either clicking on the pages listed below, or by using the keyword search tool below to find specific information within the annual report.-
 1
1 -
2
-
3
-
4
-
5
-
6
-
7
-
8
-
9
-
10
-
11
-
12
-
13
-
14
-
15
-
16
-
17
-
18
-
19
-
20
-
21
-
22
-
23
-
24
-
 25
25 -
 26
26 -
 27
27 -
 28
28 -
 29
29 -
 30
30 -
 31
31 -
 32
32 -
 33
33 -
 34
34 -
 35
35 -
 36
36 -
 37
37 -
 38
38 -
 39
39 -
 40
40 -
 41
41 -
 42
42 -
 43
43 -
 44
44 -
 45
45 -
46
-
47
-
48
-
49
-
50
-
51
-
52
-
53
-
54
-
55
-
56
-
57
-
58
-
59
-
60
-
61
-
62
-
63
-
64
-
65
-
66
-
67
-
68
-
69
-
70
-
71
-
72
 |
 |

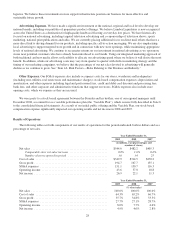
Year Ended December 31, 2009 Compared to Year Ended December 31, 2008
Net Sales.
For the year ended
December 31,
2009 2008
(dollars in thousands)
Net sales ................................................ $544,568 $482,179
Comparable store net sales increase ........................... 0.0% 1.6%
Net sales for 2009 increased $62.4 million, or 12.9%, over 2008 due to an increase of $62.6 million in non-comparable
store net sales offset by a $0.2 million decrease in comparable store net sales. In addition to the demand increase discussed in
“Highlights”, net sales increased due principally to the following factors:
• Net sales benefited from more consistent in-stock positions of certain key product lines, including product lines
customers expect to be in-stock at a store location, such as laminates, moldings and accessories. Our sales mix of
moldings and accessories increased to 12.7% of total net sales in 2009, from 11.0% in 2008. These benefits were
partially offset by decreased net sales in certain hardwood product lines, including Bellawood, engineered and
unfinished.
• Comparable store net sales benefited from the continued maturation of stores in operation for 13 to 36 months at
December 31, 2009, where net sales increased 15.7%. Net sales at these comparable stores generally increase faster
than at our stores in operation for more than 36 months, which decreased 3.9%. We believe our stores in operation
for more than 36 months are more likely to be adversely impacted by the opening of non-comparable stores in an
existing market. Excluding the net sales of markets which include a non-comparable store and at least one
comparable store older than 36 months, net sales at these more mature stores increased 0.6%.
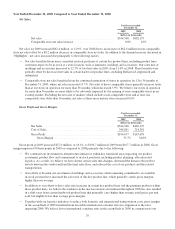
Gross Profit and Gross Margin.
For the year ended
December 31,
2009 2008
(dollars in thousands)
Net Sales ................................................ $544,568 $482,179
Cost of Sales ............................................. 349,891 314,501
Gross Profit .............................................. $194,677 $167,678
Gross Margin ........................................ 35.7% 34.8%
Gross profit in 2009 increased $27.0 million, or 16.1%, to $194.7 million in 2009 from $167.7 million in 2008. Gross
margin improved 90 basis points in 2009 as compared to 2008 primarily due to the following:
• We continued our investment in infrastructure initiatives within key functional areas impacting our product
assortment, product flow and commitment to in-stock positions, including product planning, allocation and
logistics. As a result, we believe we have driven certain sales mix changes, shortened the distance the product
travels between the vendor-mill and the final sales floor, and reduced the cost of our products and the related
transportation.
• Our efforts to broaden our assortment of moldings and accessories while remaining committed to an available
in-stock position have increased the sales mix of this key product line, which generally carries gross margins
higher than our average.
• In addition to our efforts to drive sales mix increases in certain key product lines and the premium products within
those product lines, we believe the weakness in the macroeconomic environment throughout 2009 has also resulted
in a shift away from certain hardwood product lines that generally carry higher than average retail prices per unit
sold, but slightly lower than average gross margins.
• Together with our logistics initiatives to reduce both domestic and international transportation costs, gross margin
in the second half of 2009 benefited from favorable international container rates in comparison to the rates
impacting 2008. We believe lower international container rates in the second half of 2009 in comparison to our
29