Lumber Liquidators 2009 Annual Report Download - page 32
Download and view the complete annual report
Please find page 32 of the 2009 Lumber Liquidators annual report below. You can navigate through the pages in the report by either clicking on the pages listed below, or by using the keyword search tool below to find specific information within the annual report.-
 1
1 -
2
-
3
-
4
-
5
-
6
-
7
-
8
-
9
-
10
-
11
-
12
-
13
-
14
-
15
-
16
-
17
-
18
-
19
-
20
-
21
-
 22
22 -
 23
23 -
 24
24 -
 25
25 -
 26
26 -
 27
27 -
 28
28 -
 29
29 -
 30
30 -
 31
31 -
 32
32 -
 33
33 -
 34
34 -
 35
35 -
 36
36 -
 37
37 -
 38
38 -
 39
39 -
 40
40 -
 41
41 -
 42
42 -
43
-
44
-
45
-
46
-
47
-
48
-
49
-
50
-
51
-
52
-
53
-
54
-
55
-
56
-
57
-
58
-
59
-
60
-
61
-
62
-
63
-
64
-
65
-
66
-
67
-
68
-
69
-
70
-
71
-
72
 |
 |
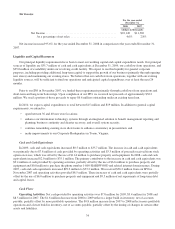
China Consolidation Center.In September 2009, we implemented a pilot program where certain quantities of
designated products produced in Asia are shipped in bulk to the consolidation center in Shanghai, China where our product
allocation department determines an appropriate mix of a number of products to be packed in a single container and shipped
directly to a store location. The majority of our stores do not have sufficient warehouse capacity to allow direct shipment of
containers of a single product or a small number of products. The pilot program included approximately 17 stores primarily
on the west coast and a limited number of our products. Through December 31, 2009, the consolidation center had shipped
nearly 2.0 million square feet (sft) of product, of which some 1.4 million sft had been received directly by our store locations,
including approximately 0.7 million sft in December 2009 alone. We expect this logistics alternative to grow in volume
throughout 2010 as additional stores and products are added to the program.
External Factors Impacting Our Business
The wood flooring market for homeowners is highly fragmented and dependent on home-related discretionary spending,
which is influenced by a number of complex economic and demographic factors that may vary locally, regionally and
nationally. We are impacted by home remodeling activity, employment levels, housing turnover, real estate prices, new
housing starts, consumer confidence, credit availability and the general health of consumer discretionary spending. Many of
the economic indicators associated with the wood flooring market and more generally associated with consumer
discretionary spending were weak throughout 2009, following the unusual turbulence in the economy in the fourth quarter of
2008. Though we believe we have seen early signs of stabilization in the second half of 2009, the wood flooring market is
likely to remain in a weakened state in 2010, with only gradual recovery expected as the year progresses. We believe the
number of retailers serving the homeowner-based segment of the wood flooring market will continue to decline and present
an opportunity for market share growth, primarily through store base expansion. In addition, we also believe that the longer
term trends for our industry are favorable, including customer perception of hardwood flooring as an attractive alternative to
other floor coverings, home improvement spending, home ownership, increasing home size and demographic trends. See
“Item 1A. Risk Factors—Risks Related to Our Business and Industry.”
Assessing the Performance of Our Business
In assessing the performance of our business, we consider a variety of performance and financial measures. The key
measures we use to determine how our business is performing are net sales, including the growth in our store base and
comparable store net sales, and the gross profit and gross margin of those net sales. Some of the operational metrics that we
consider in evaluating net sales include our product line sales mix, our average sale and implied number of customers
invoiced, future demand as measured by open orders and the related customer deposits, the average number of days an order/
customer deposit is outstanding, requests for samples and catalogs, new store performance levels and our new store pipeline.
In assessing the overall performance of our business, we also consider selling, general and administrative expenses, including
labor costs and advertising expenses.
Net Sales. We derive net sales primarily from sales of solid and engineered hardwoods, laminate, resilient, bamboo and
cork flooring products, moldings and flooring accessories made through our stores, call center, website and catalogs. Net
sales, which include freight costs billed to customers, are net of any returns by customers. Net sales from customer orders
placed through the call center, our website or our catalogs are recorded by the store where the customer picks up the
merchandise or schedules delivery. Several factors affect our net sales in any period, including the number of stores in
operation and comparable store net sales for any given store or group of stores, which can be influenced by our operational
effectiveness, pricing, marketing and promotional efforts, brand recognition levels, local competition and trade area
demographics.
Growth In Our Store Base. We opened 36 stores in 2009, 34 stores in 2008 and 25 stores in 2007, which contributed
substantially to the growth of our net sales in those years. We plan to open between 36 and 40 new stores during each of the
next several years. Our new stores require a minimal capital investment, primarily merchandise inventory, showroom display
fixtures and point of sale equipment. We are able to adapt a range of existing buildings in a market and open a new store
quickly. Our new stores have historically opened with an initial ramp-up period typically lasting approximately 36 months
during which they have generated net sales below the levels at which we expect them to normalize. Our average new store
across our markets has, however, historically become profitable within three months of beginning operations and generally
returned its initial cash investment within one year. See “Item 1A. Risk Factors—Risks Related to Our Business and
Industry.”
Comparable Store Net Sales. The other important driver of growth in our net sales has been increased comparable store
net sales, which have accounted for a substantial portion of our historical net sales growth. Stores generally enter the
26