LinkedIn 2014 Annual Report Download - page 97
Download and view the complete annual report
Please find page 97 of the 2014 LinkedIn annual report below. You can navigate through the pages in the report by either clicking on the pages listed below, or by using the keyword search tool below to find specific information within the annual report.-
 1
1 -
2
-
3
-
4
-
5
-
6
-
7
-
8
-
9
-
10
-
11
-
12
-
13
-
14
-
15
-
16
-
17
-
18
-
19
-
20
-
21
-
22
-
23
-
24
-
25
-
26
-
27
-
28
-
29
-
30
-
31
-
32
-
33
-
34
-
35
-
36
-
37
-
38
-
39
-
40
-
41
-
42
-
43
-
44
-
45
-
46
-
47
-
48
-
49
-
50
-
51
-
52
-
53
-
54
-
55
-
56
-
57
-
58
-
59
-
60
-
61
-
62
-
63
-
64
-
65
-
66
-
67
-
68
-
69
-
70
-
71
-
72
-
73
-
74
-
75
-
76
-
77
-
78
-
79
-
80
-
81
-
82
-
83
-
84
-
85
-
86
-
 87
87 -
 88
88 -
 89
89 -
 90
90 -
 91
91 -
 92
92 -
 93
93 -
 94
94 -
 95
95 -
 96
96 -
 97
97 -
 98
98 -
 99
99 -
 100
100 -
 101
101 -
 102
102 -
 103
103 -
 104
104 -
 105
105 -
 106
106 -
 107
107 -
108
-
109
-
110
-
111
-
112
-
113
-
114
-
115
-
116
-
117
-
118
-
119
-
120
-
121
-
122
-
123
-
124
-
125
-
126
-
127
-
128
-
129
-
130
-
131
 |
 |

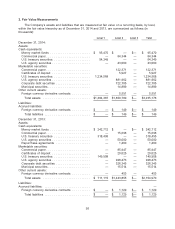
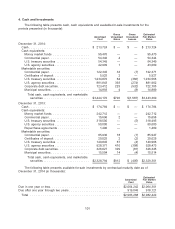
2. Fair Value Measurements
The Company’s assets and liabilities that are measured at fair value on a recurring basis, by level,
within the fair value hierarchy as of December 31, 2014 and 2013, are summarized as follows (in
thousands):
Level 1 Level 2 Level 3 Total
December 31, 2014:
Assets:
Cash equivalents:
Money market funds ...................... $ 95,470 $ — $— $ 95,470
Commercial paper ........................ — 54,344 — 54,344
U.S. treasury securities .................... 54,349 — — 54,349
U.S. agency securities ..................... — 43,000 — 43,000
Marketable securities:
Commercial paper ........................ 122,371 — 122,371
Certificates of deposit ..................... 5,927 — 5,927
U.S. treasury securities .................... 1,234,568 — 1,234,568
U.S. agency securities ..................... 881,962 — 881,962
Corporate debt securities ................... 722,705 — 722,705
Municipal securities ....................... 14,889 — 14,889
Other current assets:
Foreign currency derivative contracts .......... — 5,591 — 5,591
Total assets .......................... $1,384,387 $1,850,789 $— $3,235,176
Liabilities:
Accrued liabilities:
Foreign currency derivative contracts .......... $ — $ 149 $— $ 149
Total liabilities ......................... $ — $ 149 $— $ 149
December 31, 2013:
Assets:
Cash equivalents:
Money market funds ...................... $ 242,712 $ — $— $ 242,712
Commercial paper ........................ — 15,698 — 15,698
U.S. treasury securities .................... 318,495 — — 318,495
U.S. agency securities ..................... — 50,000 — 50,000
Repurchase agreements ................... — 1,400 — 1,400
Marketable securities:
Commercial paper ........................ — 85,947 — 85,947
Certificates of deposit ..................... — 20,025 — 20,025
U.S. treasury securities .................... 149,908 — — 149,908
U.S. agency securities ..................... — 928,473 — 928,473
Corporate debt securities ................... — 326,345 — 326,345
Municipal securities ....................... — 15,514 — 15,514
Other current assets:
Foreign currency derivative contracts .......... — 453 — 453
Total assets .......................... $ 711,115 $1,443,855 $— $2,154,970
Liabilities:
Accrued liabilities: ......................... —
Foreign currency derivative contracts .......... $ — $ 1,129 $— $ 1,129
Total liabilities ......................... $ — $ 1,129 $— $ 1,129
95