LinkedIn 2014 Annual Report Download - page 63
Download and view the complete annual report
Please find page 63 of the 2014 LinkedIn annual report below. You can navigate through the pages in the report by either clicking on the pages listed below, or by using the keyword search tool below to find specific information within the annual report.-
 1
1 -
2
-
3
-
4
-
5
-
6
-
7
-
8
-
9
-
10
-
11
-
12
-
13
-
14
-
15
-
16
-
17
-
18
-
19
-
20
-
21
-
22
-
23
-
24
-
25
-
26
-
27
-
28
-
29
-
30
-
31
-
32
-
33
-
34
-
35
-
36
-
37
-
38
-
39
-
40
-
41
-
42
-
43
-
44
-
45
-
46
-
47
-
48
-
49
-
50
-
51
-
52
-
 53
53 -
 54
54 -
 55
55 -
 56
56 -
 57
57 -
 58
58 -
 59
59 -
 60
60 -
 61
61 -
 62
62 -
 63
63 -
 64
64 -
 65
65 -
 66
66 -
 67
67 -
 68
68 -
 69
69 -
 70
70 -
 71
71 -
 72
72 -
 73
73 -
74
-
75
-
76
-
77
-
78
-
79
-
80
-
81
-
82
-
83
-
84
-
85
-
86
-
87
-
88
-
89
-
90
-
91
-
92
-
93
-
94
-
95
-
96
-
97
-
98
-
99
-
100
-
101
-
102
-
103
-
104
-
105
-
106
-
107
-
108
-
109
-
110
-
111
-
112
-
113
-
114
-
115
-
116
-
117
-
118
-
119
-
120
-
121
-
122
-
123
-
124
-
125
-
126
-
127
-
128
-
129
-
130
-
131
 |
 |

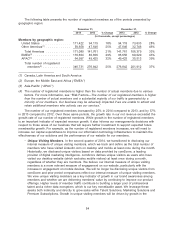
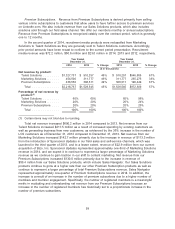
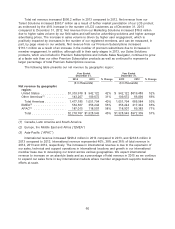
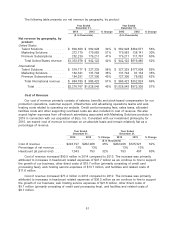
The following table presents our net revenue by geography, by product:
Year Ended Year Ended
December 31, December 31,
2014 2013 % Change 2013 2012 % Change
($ in thousands) ($ in thousands)
Net revenue by geography, by
product:
United States
Talent Solutions ............ $ 809,560 $ 582,928 39% $ 582,928 $369,577 58%
Marketing Solutions .......... 272,179 179,983 51% 179,983 138,141 30%
Premium Subscriptions ....... 252,239 179,211 41% 179,211 111,767 60%
Total United States revenue . . $1,333,978 $ 942,122 42% $ 942,122 $619,485 52%
International
Talent Solutions ............ $ 518,177 $ 327,329 58% $ 327,329 $177,008 85%
Marketing Solutions .......... 182,321 131,794 38% 131,794 97,134 36%
Premium Subscriptions ....... 184,291 127,300 45% 127,300 78,682 62%
Total International revenue . . . $ 884,789 $ 586,423 51% $ 586,423 $352,824 66%
Total ................. $2,218,767 $1,528,545 45% $1,528,545 $972,309 57%
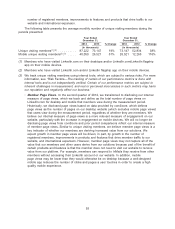
Cost of Revenue
Our cost of revenue primarily consists of salaries, benefits and stock-based compensation for our
production operations, customer support, infrastructure and advertising operations teams and web
hosting costs related to operating our website. Credit card processing fees, sales taxes, allocated
facilities costs and other supporting overhead costs are also included in cost of revenue. We also
expect higher expenses from off-network advertising associated with Marketing Solutions products in
2015 in connection with our acquisition of Bizo, Inc. Consistent with our investment philosophy for
2015, we expect cost of revenue to increase on an absolute basis and remain relatively flat as a
percentage of revenue.
Year Ended Year Ended
December 31, December 31,
2014 2013 % Change 2013 2012 % Change
($ in thousands)
Cost of revenue ............ $293,797 $202,908 45% $202,908 $125,521 62%
Percentage of net revenue ..... 13% 13% 13% 13%
Headcount (at period end) ..... 1,043 793 32% 793 497 60%
Cost of revenue increased $90.9 million in 2014 compared to 2013. The increase was primarily
attributed to increases in headcount related expenses of $47.7 million as we continue to hire to support
the growth of our business, other direct costs of $15.7 million (primarily consisting of credit card
processing fees), web hosting service expenses of $13.7 million, and facilities and related costs of
$11.8 million.
Cost of revenue increased $77.4 million in 2013 compared to 2012. The increase was primarily
attributed to increases in headcount related expenses of $36.5 million as we continue to hire to support
the growth of our business, web hosting service expenses of $21.8 million, other direct costs of
$9.1 million (primarily consisting of credit card processing fees), and facilities and related costs of
$8.7 million.
61