LinkedIn 2014 Annual Report Download - page 88
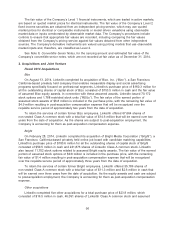
Download and view the complete annual report
Please find page 88 of the 2014 LinkedIn annual report below. You can navigate through the pages in the report by either clicking on the pages listed below, or by using the keyword search tool below to find specific information within the annual report.-
 1
1 -
2
-
3
-
4
-
5
-
6
-
7
-
8
-
9
-
10
-
11
-
12
-
13
-
14
-
15
-
16
-
17
-
18
-
19
-
20
-
21
-
22
-
23
-
24
-
25
-
26
-
27
-
28
-
29
-
30
-
31
-
32
-
33
-
34
-
35
-
36
-
37
-
38
-
39
-
40
-
41
-
42
-
43
-
44
-
45
-
46
-
47
-
48
-
49
-
50
-
51
-
52
-
53
-
54
-
55
-
56
-
57
-
58
-
59
-
60
-
61
-
62
-
63
-
64
-
65
-
66
-
67
-
68
-
69
-
70
-
71
-
72
-
73
-
74
-
75
-
76
-
77
-
 78
78 -
 79
79 -
 80
80 -
 81
81 -
 82
82 -
 83
83 -
 84
84 -
 85
85 -
 86
86 -
 87
87 -
 88
88 -
 89
89 -
 90
90 -
 91
91 -
 92
92 -
 93
93 -
 94
94 -
 95
95 -
 96
96 -
 97
97 -
 98
98 -
99
-
100
-
101
-
102
-
103
-
104
-
105
-
106
-
107
-
108
-
109
-
110
-
111
-
112
-
113
-
114
-
115
-
116
-
117
-
118
-
119
-
120
-
121
-
122
-
123
-
124
-
125
-
126
-
127
-
128
-
129
-
130
-
131
 |
 |

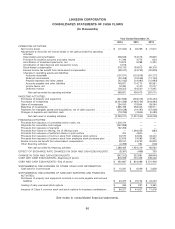
LINKEDIN CORPORATION
CONSOLIDATED STATEMENTS OF CASH FLOWS
(In thousands)
Year Ended December 31,
2014 2013 2012
OPERATING ACTIVITIES:
Net income (loss) .......................................... $ (15,320) $ 26,769 $ 21,610
Adjustments to reconcile net income (loss) to net cash provided by operating
activities:
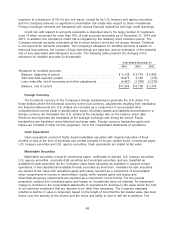
Depreciation and amortization ................................. 236,946 134,516 79,849
Provision for doubtful accounts and sales returns .................... 11,346 4,775 623
Amortization of investment premiums, net ......................... 13,613 8,268 5,330
Amortization of debt discount and transaction costs ................... 5,916 — —
Stock-based compensation .................................. 319,133 193,915 86,319
Excess income tax benefit from stock-based compensation .............. (99,247) (43,755) (35,829)
Changes in operating assets and liabilities:
Accounts receivable ..................................... (137,571) (102,618) (91,277)
Deferred commissions .................................... (22,409) (18,249) (17,145)
Prepaid expenses and other assets ............................ (42,032) (19,481) (12,993)
Accounts payable and other liabilities .......................... 149,971 114,713 85,561
Income taxes, net ....................................... 19,280 3,120 27,077
Deferred revenue ....................................... 129,325 134,500 117,945
Net cash provided by operating activities ....................... 568,951 436,473 267,070
INVESTING ACTIVITIES:
Purchases of property and equipment ............................. (547,633) (278,019) (125,420)
Purchases of investments .................................... (3,431,566) (1,493,754) (443,992)
Sales of investments ........................................ 294,033 179,904 58,594
Maturities of investments ..................................... 1,665,199 258,425 139,911
Payments for intangible assets and acquisitions, net of cash acquired ......... (253,538) (19,197) (57,036)
Changes in deposits and restricted cash ........................... (19,766) (4,904) (5,085)
Net cash used in investing activities .......................... (2,293,271) (1,357,545) (433,028)
FINANCING ACTIVITIES:
Proceeds from issuance of convertible senior notes, net .................. 1,305,414 — —
Payments for convertible note hedges ............................. (247,969) — —
Proceeds from issuance of warrants .............................. 167,296 — —
Proceeds from follow-on offering, net of offering costs ................... — 1,348,059 (382)
Proceeds from issuance of preferred shares in joint venture ............... 400 4,600 —
Proceeds from issuance of common stock from employee stock options ........ 33,577 32,824 44,402
Proceeds from issuance of common stock from employee stock purchase plan . . . 32,816 24,589 16,862
Excess income tax benefit from stock-based compensation ................ 99,247 43,755 35,829
Other financing activities ..................................... (2,296) 392 (148)
Net cash provided by financing activities ....................... 1,388,485 1,454,219 96,563
EFFECT OF EXCHANGE RATE CHANGES ON CASH AND CASH EQUIVALENTS . (6,367) (466) 755
CHANGE IN CASH AND CASH EQUIVALENTS ........................ (342,202) 532,681 (68,640)
CASH AND CASH EQUIVALENTS—Beginning of period .................. 803,089 270,408 339,048
CASH AND CASH EQUIVALENTS—End of period ...................... $ 460,887 $ 803,089 $ 270,408
SUPPLEMENTAL DISCLOSURES OF OTHER CASH FLOW INFORMATION:
Cash paid for income taxes ................................... $ 10,291 $ 6,049 $ 2,828
SUPPLEMENTAL DISCLOSURES OF NONCASH INVESTING AND FINANCING
ACTIVITIES:
Purchases of property and equipment recorded in accounts payable and accrued
liabilities .............................................. $ 43,472 $ 25,724 $ 22,223
Vesting of early exercised stock options ............................ $ 335 $ 937 $ 3,365
Issuance of Class A common stock and stock options for business combinations . . $ 64,207 $ 40,927 $ 71,478
See notes to consolidated financial statements.
86