LinkedIn 2014 Annual Report Download - page 56
Download and view the complete annual report
Please find page 56 of the 2014 LinkedIn annual report below. You can navigate through the pages in the report by either clicking on the pages listed below, or by using the keyword search tool below to find specific information within the annual report.-
 1
1 -
2
-
3
-
4
-
5
-
6
-
7
-
8
-
9
-
10
-
11
-
12
-
13
-
14
-
15
-
16
-
17
-
18
-
19
-
20
-
21
-
22
-
23
-
24
-
25
-
26
-
27
-
28
-
29
-
30
-
31
-
32
-
33
-
34
-
35
-
36
-
37
-
38
-
39
-
40
-
41
-
42
-
43
-
44
-
45
-
 46
46 -
 47
47 -
 48
48 -
 49
49 -
 50
50 -
 51
51 -
 52
52 -
 53
53 -
 54
54 -
 55
55 -
 56
56 -
 57
57 -
 58
58 -
 59
59 -
 60
60 -
 61
61 -
 62
62 -
 63
63 -
 64
64 -
 65
65 -
 66
66 -
67
-
68
-
69
-
70
-
71
-
72
-
73
-
74
-
75
-
76
-
77
-
78
-
79
-
80
-
81
-
82
-
83
-
84
-
85
-
86
-
87
-
88
-
89
-
90
-
91
-
92
-
93
-
94
-
95
-
96
-
97
-
98
-
99
-
100
-
101
-
102
-
103
-
104
-
105
-
106
-
107
-
108
-
109
-
110
-
111
-
112
-
113
-
114
-
115
-
116
-
117
-
118
-
119
-
120
-
121
-
122
-
123
-
124
-
125
-
126
-
127
-
128
-
129
-
130
-
131
 |
 |

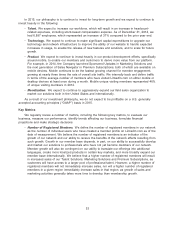
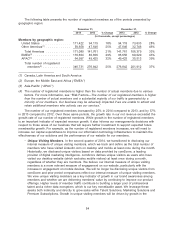
The following table presents the number of registered members as of the periods presented by
geographic region:
December 31, December 31,
2014 2013 % Change 2013 2012 % Change
(in thousands, except percentages)
Members by geographic region:
United States ................ 111,422 94,115 18% 94,115 73,633 28%
Other Americas(1) ............. 59,658 47,646 25% 47,646 32,746 46%
Total Americas ............. 171,080 141,761 21% 141,761 106,379 33%
EMEA(2) .................... 110,654 85,656 29% 85,656 60,020 43%
APAC(3) .................... 64,997 49,425 32% 49,425 35,513 39%
Total number of registered
members(4) ............... 346,731 276,842 25% 276,842 201,912 37%
(1) Canada, Latin America and South America
(2) Europe, the Middle East and Africa (‘‘EMEA’’)
(3) Asia-Pacific (‘‘APAC’’)
(4) The number of registered members is higher than the number of actual members due to various
factors. For more information, see ‘‘Risk Factors—The number of our registered members is higher
than the number of actual members and a substantial majority of our traffic is generated by a
minority of our members. Our business may be adversely impacted if we are unable to attract and
retain additional members who actively use our services.’’
The number of our registered members increased by 25% in 2014 compared to 2013, and by 37%
in 2013 compared to 2012. Over these same periods, the growth rate in our net revenue exceeded the
growth rate of our number of registered members. While growth in the number of registered members
is an important indicator of expected revenue growth, it also informs our management’s decisions with
respect to those areas of our business that will require further investment to support expected future
membership growth. For example, as the number of registered members increases, we will need to
increase our capital expenditures to improve our information technology infrastructure to maintain the
effectiveness of our solutions and the performance of our website for our members.
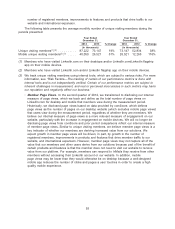
•Unique Visiting Members. In the second quarter of 2014, we transitioned to disclosing our
internal measure of unique visiting members, which we track and define as the total number of
members who have visited LinkedIn.com on desktop and mobile at least once during the month.
Historically, we disclosed unique visitors based on data provided by comScore, a leading
provider of digital marketing intelligence. comScore defines unique visitors as users who have
visited our desktop website (which excludes mobile visitors) at least once during a month,
regardless of whether they are members. We believe our internal measure of unique visiting
members is a more relevant measure of engagement on our website, particularly with the
increase in engagement on mobile devices. We will no longer be disclosing unique visitors from
comScore and prior period comparisons reflect our internal measure of unique visiting members.
We view unique visiting members as a key indicator of growth in our brand awareness among
members and whether we are delivering members’ value by continuing to improve our product
offerings. Higher levels of member traffic contribute to building a larger pool of professional
talent and a richer data ecosystem, which is our key monetizable asset. We leverage these
assets both indirectly and directly to grow sales within Talent Solutions, Marketing Solutions and
Premium Subscriptions. Growth in unique visiting members will be driven by growth in the
54