LinkedIn 2014 Annual Report Download - page 68
Download and view the complete annual report
Please find page 68 of the 2014 LinkedIn annual report below. You can navigate through the pages in the report by either clicking on the pages listed below, or by using the keyword search tool below to find specific information within the annual report.-
 1
1 -
2
-
3
-
4
-
5
-
6
-
7
-
8
-
9
-
10
-
11
-
12
-
13
-
14
-
15
-
16
-
17
-
18
-
19
-
20
-
21
-
22
-
23
-
24
-
25
-
26
-
27
-
28
-
29
-
30
-
31
-
32
-
33
-
34
-
35
-
36
-
37
-
38
-
39
-
40
-
41
-
42
-
43
-
44
-
45
-
46
-
47
-
48
-
49
-
50
-
51
-
52
-
53
-
54
-
55
-
56
-
57
-
 58
58 -
 59
59 -
 60
60 -
 61
61 -
 62
62 -
 63
63 -
 64
64 -
 65
65 -
 66
66 -
 67
67 -
 68
68 -
 69
69 -
 70
70 -
 71
71 -
 72
72 -
 73
73 -
 74
74 -
 75
75 -
 76
76 -
 77
77 -
 78
78 -
79
-
80
-
81
-
82
-
83
-
84
-
85
-
86
-
87
-
88
-
89
-
90
-
91
-
92
-
93
-
94
-
95
-
96
-
97
-
98
-
99
-
100
-
101
-
102
-
103
-
104
-
105
-
106
-
107
-
108
-
109
-
110
-
111
-
112
-
113
-
114
-
115
-
116
-
117
-
118
-
119
-
120
-
121
-
122
-
123
-
124
-
125
-
126
-
127
-
128
-
129
-
130
-
131
 |
 |

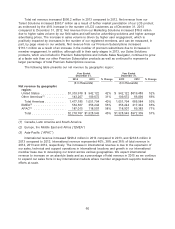
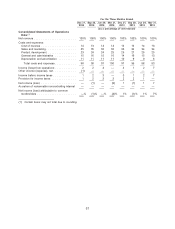
Item 8 of this Annual Report on Form 10-K. The results of historical periods are not necessarily
indicative of the results of operations for a full year or any future period.
For the Three Months Ended
Dec 31, Sep 30, Jun 30, Mar 31, Dec 31, Sep 30, Jun 30, Mar 31,
2014 2014 2014 2014 2013 2013 2013 2013
(in thousands, except per share data)
Consolidated Statements
of Operations Data:
Net revenue ........... $643,432 $568,265 $533,877 $473,193 $447,219 $392,960 $363,661 $324,705
Costs and expenses:
Cost of revenue (exclusive
of depreciation and
amortization shown
separately below)(1) .... 86,902 74,904 69,536 62,455 57,865 53,395 49,264 42,384
Sales and marketing(1) . . . 224,227 199,168 184,494 166,522 157,235 133,172 122,276 109,417
Product development(1) . . . 150,289 136,542 128,731 120,622 113,140 106,223 95,608 80,672
General and
administrative(1) ...... 96,722 89,266 80,688 74,618 64,790 61,767 56,225 42,784
Depreciation and
amortization ......... 71,118 59,782 56,306 49,740 42,750 33,767 32,193 25,806
Total costs and
expenses ......... 629,258 559,662 519,755 473,957 435,780 388,324 355,566 301,063
Income (loss) from
operations ........... 14,174 8,603 14,122 (764) 11,439 4,636 8,095 23,642
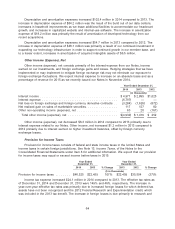
Other income (expense), net (7,305) 152 1,197 1,026 1,820 156 (252) (308)
Income before income taxes . 6,869 8,755 15,319 262 13,259 4,792 7,843 23,334
Provision for income taxes . . 3,774 12,917 16,253 13,581 9,477 8,155 4,109 718
Net income (loss) ........ 3,095 (4,162) (934) (13,319) 3,782 (3,363) 3,734 22,616
Accretion of redeemable
noncontrolling interest . . . (100) (101) (100) (126) ————
Net income (loss) attributable
to common stockholders . . $ 2,995 $ (4,263) $ (1,034) $ (13,445) $ 3,782 $ (3,363) $ 3,734 $ 22,616
Net income (loss) per share
attributable to common
stockholders:
Basic ............. $ 0.02 $ (0.03) $ (0.01) $ (0.11) $ 0.03 $ (0.03) $ 0.03 $ 0.21
Diluted ............ $ 0.02 $ (0.03) $ (0.01) $ (0.11) $ 0.03 $ (0.03) $ 0.03 $ 0.20
Weighted-average shares
used to compute net
income (loss) per share
attributable to common
stockholders:
Basic ............. 124,590 123,427 122,170 120,967 119,849 113,940 111,214 109,445
Diluted ............ 127,338 123,427 122,170 120,967 124,438 113,940 116,627 115,398
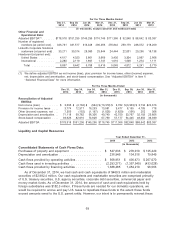
(1) Stock-based compensation included in above line items:
Cost of revenue ................ $ 8,614 $ 7,336 $ 6,831 $ 5,836 $ 4,783 $ 4,098 $ 3,913 $ 2,806
Sales and marketing ............. 18,725 15,334 13,926 12,181 10,630 9,853 8,843 6,861
Product development ............ 44,134 40,014 37,582 33,126 29,152 27,186 24,885 17,638
General and administrative ........ 22,153 20,226 16,489 16,626 12,612 13,308 10,713 6,634
Total stock-based compensation . . . $93,626 $82,910 $74,828 $67,769 $57,177 $54,445 $48,354 $33,939
66