LinkedIn 2014 Annual Report Download - page 57
Download and view the complete annual report
Please find page 57 of the 2014 LinkedIn annual report below. You can navigate through the pages in the report by either clicking on the pages listed below, or by using the keyword search tool below to find specific information within the annual report.-
 1
1 -
2
-
3
-
4
-
5
-
6
-
7
-
8
-
9
-
10
-
11
-
12
-
13
-
14
-
15
-
16
-
17
-
18
-
19
-
20
-
21
-
22
-
23
-
24
-
25
-
26
-
27
-
28
-
29
-
30
-
31
-
32
-
33
-
34
-
35
-
36
-
37
-
38
-
39
-
40
-
41
-
42
-
43
-
44
-
45
-
46
-
 47
47 -
 48
48 -
 49
49 -
 50
50 -
 51
51 -
 52
52 -
 53
53 -
 54
54 -
 55
55 -
 56
56 -
 57
57 -
 58
58 -
 59
59 -
 60
60 -
 61
61 -
 62
62 -
 63
63 -
 64
64 -
 65
65 -
 66
66 -
 67
67 -
68
-
69
-
70
-
71
-
72
-
73
-
74
-
75
-
76
-
77
-
78
-
79
-
80
-
81
-
82
-
83
-
84
-
85
-
86
-
87
-
88
-
89
-
90
-
91
-
92
-
93
-
94
-
95
-
96
-
97
-
98
-
99
-
100
-
101
-
102
-
103
-
104
-
105
-
106
-
107
-
108
-
109
-
110
-
111
-
112
-
113
-
114
-
115
-
116
-
117
-
118
-
119
-
120
-
121
-
122
-
123
-
124
-
125
-
126
-
127
-
128
-
129
-
130
-
131
 |
 |

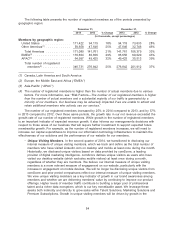
number of registered members, improvements to features and products that drive traffic to our
website and international expansion.
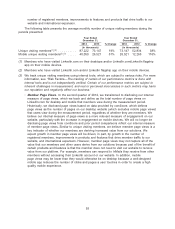
The following table presents the average monthly number of unique visiting members during the
periods presented:
Year Ended Year Ended
December 31, December 31,
2014 2013 % Change 2013 2012 % Change
(in thousands) (in thousands)
Unique visiting members(1),(3) .......... 87,222 73,147 19% 73,147 52,834 38%
Mobile unique visiting members(2),(3) ..... 40,050 26,521 51% 26,521 12,265 116%
(1) Members who have visited LinkedIn.com on their desktops and/or LinkedIn.com/LinkedIn flagship
app on their mobile devices.
(2) Members who have visited LinkedIn.com and/or LinkedIn flagship app on their mobile devices.
(3) We track unique visiting members using internal tools, which are subject to various risks. For more
information, see ‘‘Risk Factors—The tracking of certain of our performance metrics is done with
internal tools and is not independently verified. Certain of our performance metrics are subject to
inherent challenges in measurement, and real or perceived inaccuracies in such metrics may harm
our reputation and negatively affect our business.’’
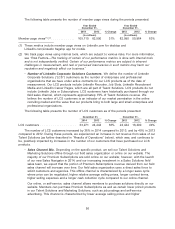
•Member Page Views. In the second quarter of 2014, we transitioned to disclosing our internal
measure of page views, which we track and define as the total number of page views on
LinkedIn.com for desktop and mobile that members view during the measurement period.
Historically, we disclosed page views based on data provided by comScore, which defines
page views as the number of pages on our desktop website (which excludes mobile page views)
that users view during the measurement period, regardless of whether they are members. We
believe our internal measure of page views is a more relevant measure of engagement on our
website, particularly with the increase in engagement on mobile devices. We will no longer be
disclosing page views from comScore and prior period comparisons reflect our internal measure
of member page views. Similar to unique visiting members, we believe member page views is a
key indicator of whether our members are deriving increased value from our solutions. We
expect growth in member page views will be driven, in part, by growth in the number of
registered members, improvements in products and features that drive member traffic to our
website, and international expansion. However, member page views may not capture all of the
value that our members and other users derive from our solutions because part of the benefit of
certain products and features is that the member does not need to visit our website to receive
value from our platform. For example, members can respond to InMails they receive from other
members without accessing their LinkedIn account or our website. In addition, mobile
page views may be lower than they would otherwise be on desktop because a well-designed
mobile app reduces the number of clicks and pages a user touches in order to create a high
quality mobile experience.
55