LinkedIn 2014 Annual Report Download - page 117
Download and view the complete annual report
Please find page 117 of the 2014 LinkedIn annual report below. You can navigate through the pages in the report by either clicking on the pages listed below, or by using the keyword search tool below to find specific information within the annual report.-
 1
1 -
2
-
3
-
4
-
5
-
6
-
7
-
8
-
9
-
10
-
11
-
12
-
13
-
14
-
15
-
16
-
17
-
18
-
19
-
20
-
21
-
22
-
23
-
24
-
25
-
26
-
27
-
28
-
29
-
30
-
31
-
32
-
33
-
34
-
35
-
36
-
37
-
38
-
39
-
40
-
41
-
42
-
43
-
44
-
45
-
46
-
47
-
48
-
49
-
50
-
51
-
52
-
53
-
54
-
55
-
56
-
57
-
58
-
59
-
60
-
61
-
62
-
63
-
64
-
65
-
66
-
67
-
68
-
69
-
70
-
71
-
72
-
73
-
74
-
75
-
76
-
77
-
78
-
79
-
80
-
81
-
82
-
83
-
84
-
85
-
86
-
87
-
88
-
89
-
90
-
91
-
92
-
93
-
94
-
95
-
96
-
97
-
98
-
99
-
100
-
101
-
102
-
103
-
104
-
105
-
106
-
 107
107 -
 108
108 -
 109
109 -
 110
110 -
 111
111 -
 112
112 -
 113
113 -
 114
114 -
 115
115 -
 116
116 -
 117
117 -
 118
118 -
 119
119 -
 120
120 -
 121
121 -
 122
122 -
 123
123 -
 124
124 -
 125
125 -
 126
126 -
 127
127 -
128
-
129
-
130
-
131
 |
 |

are determined based upon the difference between the consolidated financial statement carrying
amounts and the tax basis of assets and liabilities and are measured using the enacted tax rate
expected to apply to taxable income in the years in which the differences are expected to be reversed.
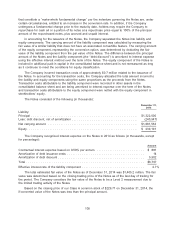
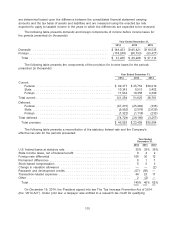
The following table presents domestic and foreign components of income before income taxes for
the periods presented (in thousands):
Year Ended December 31,
2014 2013 2012
Domestic ......................................... $149,453 $145,421 $110,535
Foreign ........................................... (118,248) (96,193) (53,421)
Total ........................................... $ 31,205 $ 49,228 $ 57,114
The following table presents the components of the provision for income taxes for the periods
presented (in thousands):
Year Ended December 31,
2014 2013 2012
Current:
Federal ......................................... $ 99,377 $ 35,754 $30,919
State ........................................... 10,343 5,513 3,452
Foreign ......................................... 11,534 10,358 4,390
Total current ......................................... 121,254 51,625 38,761
Deferred:
Federal ......................................... (67,415) (25,469) (395)
State ........................................... (5,992) (2,579) (2,629)
Foreign ......................................... (1,322) (1,118) (233)
Total deferred ........................................ (74,729) (29,166) (3,257)
Total provision ...................................... $ 46,525 $ 22,459 $35,504
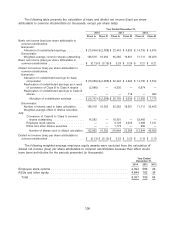
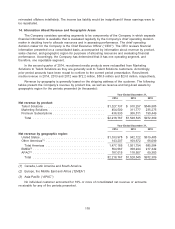
The following table presents a reconciliation of the statutory federal rate and the Company’s
effective tax rate for the periods presented:
Year Ended
December 31,
2014 2013 2012
U.S. federal taxes at statutory rate ................................... 35% 35% 35%
State income taxes, net of federal benefit .............................. 9 4 2
Foreign rate differential ........................................... 106 36 12
Permanent differences ............................................ 5 1 1
Stock-based compensation ......................................... 5 5 3
Change in valuation allowance ...................................... — — (2)
Research and development credits ................................... (57) (56) —
Transaction-related expenses ....................................... 44 23 11
Other ........................................................ 2 (2) —
Total ....................................................... 149% 46% 62%
On December 19, 2014, the President signed into law The Tax Increase Prevention Act of 2014
(the ‘‘2014 Act’’). Under prior law, a taxpayer was entitled to a research tax credit for qualifying
115