LinkedIn 2014 Annual Report Download - page 71
Download and view the complete annual report
Please find page 71 of the 2014 LinkedIn annual report below. You can navigate through the pages in the report by either clicking on the pages listed below, or by using the keyword search tool below to find specific information within the annual report.-
 1
1 -
2
-
3
-
4
-
5
-
6
-
7
-
8
-
9
-
10
-
11
-
12
-
13
-
14
-
15
-
16
-
17
-
18
-
19
-
20
-
21
-
22
-
23
-
24
-
25
-
26
-
27
-
28
-
29
-
30
-
31
-
32
-
33
-
34
-
35
-
36
-
37
-
38
-
39
-
40
-
41
-
42
-
43
-
44
-
45
-
46
-
47
-
48
-
49
-
50
-
51
-
52
-
53
-
54
-
55
-
56
-
57
-
58
-
59
-
60
-
 61
61 -
 62
62 -
 63
63 -
 64
64 -
 65
65 -
 66
66 -
 67
67 -
 68
68 -
 69
69 -
 70
70 -
 71
71 -
 72
72 -
 73
73 -
 74
74 -
 75
75 -
 76
76 -
 77
77 -
 78
78 -
 79
79 -
 80
80 -
 81
81 -
82
-
83
-
84
-
85
-
86
-
87
-
88
-
89
-
90
-
91
-
92
-
93
-
94
-
95
-
96
-
97
-
98
-
99
-
100
-
101
-
102
-
103
-
104
-
105
-
106
-
107
-
108
-
109
-
110
-
111
-
112
-
113
-
114
-
115
-
116
-
117
-
118
-
119
-
120
-
121
-
122
-
123
-
124
-
125
-
126
-
127
-
128
-
129
-
130
-
131
 |
 |

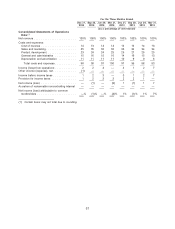
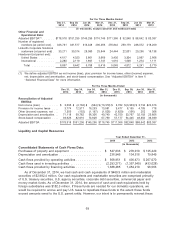
For the Three Months Ended
Dec 31, Sep 30, Jun 30, Mar 31, Dec 31, Sep 30, Jun 30, Mar 31,
2014 2014 2014 2014 2013 2013 2013 2013
(in thousands, except customer and headcount data)
Other Financial and
Operational Data:
Adjusted EBITDA(1) ....... $178,918 $151,295 $145,256 $116,745 $111,366 $ 92,848 $ 88,642 $ 83,387
Number of registered
members (at period end) . . 346,731 331,517 313,428 296,466 276,842 259,179 238,072 218,269
LinkedIn Corporate Solutions
customers (at period end) . 33,271 30,314 28,080 25,844 24,444 22,001 20,256 18,138
Headcount (at period end):
United States ......... 4,617 4,323 3,861 3,669 3,435 3,304 2,967 2,668
International .......... 2,280 2,119 1,897 1,747 1,610 1,508 1,274 1,111
Total ............. 6,897 6,442 5,758 5,416 5,045 4,812 4,241 3,779
(1) We define adjusted EBITDA as net income (loss), plus: provision for income taxes, other (income) expense,
net, depreciation and amortization, and stock-based compensation. See ‘‘Adjusted EBITDA’’ in Item 6
‘‘Selected Financial Data’’ for more information.
For the Three Months Ended
Dec 31, Sep 30, Jun 30, Mar 31, Dec 31, Sep 30, Jun 30, Mar 31,
2014 2014 2014 2014 2013 2013 2013 2013
(in thousands)
Reconciliation of Adjusted
EBITDA:
Net income (loss) .......... $ 3,095 $ (4,162) $ (934) $ (13,319) $ 3,782 $ (3,363) $ 3,734 $22,616
Provision for income taxes .... 3,774 12,917 16,253 13,581 9,477 8,155 4,109 718
Other (income) expense, net . . . 7,305 (152) (1,197) (1,026) (1,820) (156) 252 308
Depreciation and amortization . . 71,118 59,782 56,306 49,740 42,750 33,767 32,193 25,806
Stock-based compensation .... 93,626 82,910 74,828 67,769 57,177 54,445 48,354 33,939
Adjusted EBITDA .......... $178,918 $151,295 $145,256 $116,745 $111,366 $92,848 $88,642 $83,387
Liquidity and Capital Resources
Year Ended December 31,
2014 2013 2012
(in thousands)
Consolidated Statements of Cash Flows Data:
Purchases of property and equipment ................. $ 547,633 $ 278,019 $ 125,420
Depreciation and amortization ....................... 236,946 134,516 79,849
Cash flows provided by operating activities .............. $ 568,951 $ 436,473 $ 267,070
Cash flows used in investing activities ................. (2,293,271) (1,357,545) (433,028)
Cash flows provided by financing activities .............. 1,388,485 1,454,219 96,563
As of December 31, 2014, we had cash and cash equivalents of $460.9 million and marketable
securities of $2,982.4 million. Our cash equivalents and marketable securities are comprised primarily
of U.S. treasury securities, U.S. agency securities, corporate debt securities, commercial paper and
money market funds. As of December 31, 2014, the amount of cash and cash equivalents held by
foreign subsidiaries was $182.3 million. If these funds are needed for our domestic operations, we
would be required to accrue and pay U.S. taxes to repatriate these funds to the extent these funds
exceed amounts owed to the U.S. parent entity. However, our intent is to permanently reinvest these
69