LinkedIn 2014 Annual Report Download - page 51
Download and view the complete annual report
Please find page 51 of the 2014 LinkedIn annual report below. You can navigate through the pages in the report by either clicking on the pages listed below, or by using the keyword search tool below to find specific information within the annual report.-
 1
1 -
2
-
3
-
4
-
5
-
6
-
7
-
8
-
9
-
10
-
11
-
12
-
13
-
14
-
15
-
16
-
17
-
18
-
19
-
20
-
21
-
22
-
23
-
24
-
25
-
26
-
27
-
28
-
29
-
30
-
31
-
32
-
33
-
34
-
35
-
36
-
37
-
38
-
39
-
40
-
 41
41 -
 42
42 -
 43
43 -
 44
44 -
 45
45 -
 46
46 -
 47
47 -
 48
48 -
 49
49 -
 50
50 -
 51
51 -
 52
52 -
 53
53 -
 54
54 -
 55
55 -
 56
56 -
 57
57 -
 58
58 -
 59
59 -
 60
60 -
 61
61 -
62
-
63
-
64
-
65
-
66
-
67
-
68
-
69
-
70
-
71
-
72
-
73
-
74
-
75
-
76
-
77
-
78
-
79
-
80
-
81
-
82
-
83
-
84
-
85
-
86
-
87
-
88
-
89
-
90
-
91
-
92
-
93
-
94
-
95
-
96
-
97
-
98
-
99
-
100
-
101
-
102
-
103
-
104
-
105
-
106
-
107
-
108
-
109
-
110
-
111
-
112
-
113
-
114
-
115
-
116
-
117
-
118
-
119
-
120
-
121
-
122
-
123
-
124
-
125
-
126
-
127
-
128
-
129
-
130
-
131
 |
 |

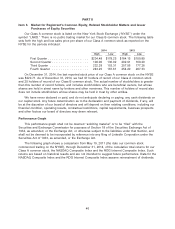
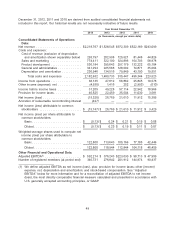
December 31, 2012, 2011 and 2010 are derived from audited consolidated financial statements not
included in this report. Our historical results are not necessarily indicative of future results.
Year Ended December 31,
2014 2013 2012 2011 2010
(in thousands, except per share data)
Consolidated Statements of Operations
Data:
Net revenue ......................... $2,218,767 $1,528,545 $972,309 $522,189 $243,099
Costs and expenses:
Cost of revenue (exclusive of depreciation
and amortization shown separately below) 293,797 202,908 125,521 81,448 44,826
Sales and marketing ................. 774,411 522,100 324,896 164,703 58,978
Product development ................. 536,184 395,643 257,179 132,222 65,104
General and administrative ............. 341,294 225,566 128,002 74,871 35,064
Depreciation and amortization ........... 236,946 134,516 79,849 43,100 19,551
Total costs and expenses .......... 2,182,632 1,480,733 915,447 496,344 223,523
Income from operations ................. 36,135 47,812 56,862 25,845 19,576
Other income (expense), net ............. (4,930) 1,416 252 (2,903) (610)
Income before income taxes ............. 31,205 49,228 57,114 22,942 18,966
Provision for income taxes ............... 46,525 22,459 35,504 11,030 3,581
Net income (loss) ..................... (15,320) 26,769 21,610 11,912 15,385
Accretion of redeemable noncontrolling interest (427) ————
Net income (loss) attributable to common
stockholders ....................... $ (15,747) $ 26,769 $ 21,610 $ 11,912 $ 3,429
Net income (loss) per share attributable to
common stockholders:
Basic ........................... $ (0.13) $ 0.24 $ 0.21 $ 0.15 $ 0.08
Diluted .......................... $ (0.13) $ 0.23 $ 0.19 $ 0.11 $ 0.07
Weighted-average shares used to compute net
income (loss) per share attributable to
common stockholders:
Basic ........................... 122,800 113,643 105,166 77,185 42,446
Diluted .......................... 122,800 118,944 112,844 104,118 46,459
Other Financial and Operational Data:
Adjusted EBITDA(1) .................... $ 592,214 $ 376,243 $223,030 $ 98,713 $ 47,959
Number of registered members (at period end) 346,731 276,842 201,912 144,974 90,437
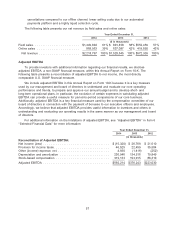
(1) We define adjusted EBITDA as net income (loss), plus: provision for income taxes; other (income)
expense, net; depreciation and amortization; and stock-based compensation. See ‘‘Adjusted
EBITDA’’ below for more information and for a reconciliation of adjusted EBITDA to net income
(loss), the most directly comparable financial measure calculated and presented in accordance with
U.S. generally accepted accounting principles, or GAAP.
49