LinkedIn 2014 Annual Report Download - page 52
Download and view the complete annual report
Please find page 52 of the 2014 LinkedIn annual report below. You can navigate through the pages in the report by either clicking on the pages listed below, or by using the keyword search tool below to find specific information within the annual report.-
 1
1 -
2
-
3
-
4
-
5
-
6
-
7
-
8
-
9
-
10
-
11
-
12
-
13
-
14
-
15
-
16
-
17
-
18
-
19
-
20
-
21
-
22
-
23
-
24
-
25
-
26
-
27
-
28
-
29
-
30
-
31
-
32
-
33
-
34
-
35
-
36
-
37
-
38
-
39
-
40
-
41
-
 42
42 -
 43
43 -
 44
44 -
 45
45 -
 46
46 -
 47
47 -
 48
48 -
 49
49 -
 50
50 -
 51
51 -
 52
52 -
 53
53 -
 54
54 -
 55
55 -
 56
56 -
 57
57 -
 58
58 -
 59
59 -
 60
60 -
 61
61 -
 62
62 -
63
-
64
-
65
-
66
-
67
-
68
-
69
-
70
-
71
-
72
-
73
-
74
-
75
-
76
-
77
-
78
-
79
-
80
-
81
-
82
-
83
-
84
-
85
-
86
-
87
-
88
-
89
-
90
-
91
-
92
-
93
-
94
-
95
-
96
-
97
-
98
-
99
-
100
-
101
-
102
-
103
-
104
-
105
-
106
-
107
-
108
-
109
-
110
-
111
-
112
-
113
-
114
-
115
-
116
-
117
-
118
-
119
-
120
-
121
-
122
-
123
-
124
-
125
-
126
-
127
-
128
-
129
-
130
-
131
 |
 |

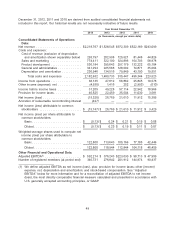
Stock-based compensation included in the consolidated statements of operations data above was
as follows:
Year Ended December 31,
2014 2013 2012 2011 2010
(in thousands)
Cost of revenue ................ $ 28,617 $ 15,600 $ 6,416 $ 1,678 $ 439
Sales and marketing ............. 60,166 36,187 17,726 8,074 1,225
Product development ............ 154,856 98,861 46,026 13,625 3,248
General and administrative ........ 75,494 43,267 16,151 6,391 3,920
Total stock-based compensation . . . $ 319,133 $ 193,915 $ 86,319 $ 29,768 $ 8,832
As of December 31,
2014 2013 2012 2011 2010
(in thousands)
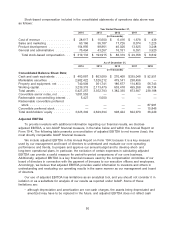
Consolidated Balance Sheet Data:
Cash and cash equivalents ........ $ 460,887 $ 803,089 $ 270,408 $339,048 $ 92,951
Marketable securities ............ 2,982,422 1,526,212 479,141 238,456 —
Property and equipment, net ....... 740,909 361,741 186,677 114,850 56,743
Working capital ................. 3,239,315 2,113,479 603,418 499,268 66,734
Total assets ................... 5,427,257 3,352,793 1,382,330 873,697 238,188
Convertible senior notes, net ....... 1,081,553 — — — —
Redeemable noncontrolling interest . . 5,427 5,000 — — —
Redeemable convertible preferred
stock ......................————87,981
Convertible preferred stock ........————15,846
Total stockholders’ equity ......... 3,325,392 2,629,394 908,424 624,979 36,249
Adjusted EBITDA
To provide investors with additional information regarding our financial results, we disclose
adjusted EBITDA, a non-GAAP financial measure, in the table below and within this Annual Report on
Form 10-K. The following table presents a reconciliation of adjusted EBITDA to net income (loss), the
most directly comparable GAAP financial measure.
We include adjusted EBITDA in this Annual Report on Form 10-K because it is a key measure
used by our management and board of directors to understand and evaluate our core operating
performance and trends, to prepare and approve our annual budget and to develop short- and
long-term operational plans. In particular, the exclusion of certain expenses in calculating adjusted
EBITDA can provide a useful measure for period-to-period comparisons of our core business.
Additionally, adjusted EBITDA is a key financial measure used by the compensation committee of our
board of directors in connection with the payment of bonuses to our executive officers and employees.
Accordingly, we believe that adjusted EBITDA provides useful information to investors and others in
understanding and evaluating our operating results in the same manner as our management and board
of directors.
Our use of adjusted EBITDA has limitations as an analytical tool, and you should not consider it in
isolation or as a substitute for analysis of our results as reported under GAAP. Some of these
limitations are:
• although depreciation and amortization are non-cash charges, the assets being depreciated and
amortized may have to be replaced in the future, and adjusted EBITDA does not reflect cash
50