LinkedIn 2014 Annual Report Download - page 70
Download and view the complete annual report
Please find page 70 of the 2014 LinkedIn annual report below. You can navigate through the pages in the report by either clicking on the pages listed below, or by using the keyword search tool below to find specific information within the annual report.-
 1
1 -
2
-
3
-
4
-
5
-
6
-
7
-
8
-
9
-
10
-
11
-
12
-
13
-
14
-
15
-
16
-
17
-
18
-
19
-
20
-
21
-
22
-
23
-
24
-
25
-
26
-
27
-
28
-
29
-
30
-
31
-
32
-
33
-
34
-
35
-
36
-
37
-
38
-
39
-
40
-
41
-
42
-
43
-
44
-
45
-
46
-
47
-
48
-
49
-
50
-
51
-
52
-
53
-
54
-
55
-
56
-
57
-
58
-
59
-
 60
60 -
 61
61 -
 62
62 -
 63
63 -
 64
64 -
 65
65 -
 66
66 -
 67
67 -
 68
68 -
 69
69 -
 70
70 -
 71
71 -
 72
72 -
 73
73 -
 74
74 -
 75
75 -
 76
76 -
 77
77 -
 78
78 -
 79
79 -
 80
80 -
81
-
82
-
83
-
84
-
85
-
86
-
87
-
88
-
89
-
90
-
91
-
92
-
93
-
94
-
95
-
96
-
97
-
98
-
99
-
100
-
101
-
102
-
103
-
104
-
105
-
106
-
107
-
108
-
109
-
110
-
111
-
112
-
113
-
114
-
115
-
116
-
117
-
118
-
119
-
120
-
121
-
122
-
123
-
124
-
125
-
126
-
127
-
128
-
129
-
130
-
131
 |
 |

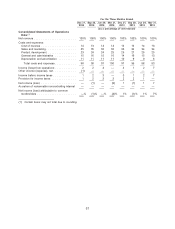
For the Three Months Ended
Dec 31, Sep 30, Jun 30, Mar 31, Dec 31, Sep 30, Jun 30, Mar 31,
2014 2014 2014 2014 2013 2013 2013 2013
(in thousands)
Additional Financial Data:
Net revenue by product:
Talent Solutions(1) ...... $369,348 $344,568 $322,227 $291,594 $261,359 $237,668 $216,938 $194,292
Marketing Solutions(1) .... 152,729 109,231 106,476 86,064 97,732 75,510 73,747 64,788
Premium Subscriptions . . . 121,355 114,466 105,174 95,535 88,128 79,782 72,976 65,625
Total ............ $643,432 $568,265 $533,877 $473,193 $447,219 $392,960 $363,661 $324,705
Net revenue by geographic
region:
United States ......... $388,194 $343,132 $317,774 $284,878 $271,140 $245,302 $224,277 $201,403
Other Americas(2) ....... 39,238 36,538 35,527 31,904 31,612 27,027 26,857 24,176
Total Americas ....... 427,432 379,670 353,301 316,782 302,752 272,329 251,134 225,579
EMEA(3) ............. 162,064 139,702 134,930 117,871 108,309 90,087 84,691 75,157
APAC(4) ............. 53,936 48,893 45,646 38,540 36,158 30,544 27,836 23,969
Total ............ $643,432 $568,265 $533,877 $473,193 $447,219 $392,960 $363,661 $324,705
Net revenue by geography,
by product:
United States
Talent Solutions(1) ...... $222,670 $208,635 $197,852 $180,403 $164,207 $152,371 $140,420 $125,930
Marketing Solutions(1) .... 94,991 68,767 59,383 49,038 55,269 45,789 41,259 37,666
Premium Subscriptions . . . 70,533 65,730 60,539 55,437 51,664 47,142 42,598 37,807
Total United States
revenue .......... $388,194 $343,132 $317,774 $284,878 $271,140 $245,302 $224,277 $201,403
International
Talent Solutions(1) ...... $146,678 $135,933 $124,375 $111,191 $ 97,152 $ 85,297 $ 76,518 $ 68,362
Marketing Solutions(1) .... 57,738 40,464 47,093 37,026 42,463 29,721 32,488 27,122
Premium Subscriptions . . . 50,822 48,736 44,635 40,098 36,464 32,640 30,378 27,818
Total International
revenue .......... $255,238 $225,133 $216,103 $188,315 $176,079 $147,658 $139,384 $123,302
Total .......... $643,432 $568,265 $533,877 $473,193 $447,219 $392,960 $363,661 $324,705
Net revenue by sales
channel:
Field sales ........... $413,867 $341,691 $318,984 $275,262 $270,672 $227,588 $209,227 $183,971
Online sales .......... 229,565 226,574 214,893 197,931 176,547 165,372 154,434 140,734
Total ............ $643,432 $568,265 $533,877 $473,193 $447,219 $392,960 $363,661 $324,705
(1) Prior period amounts have been recast to conform to the current year presentation. See Note 14, Information
About Revenue and Geographic Areas, of the Notes to Consolidated Financial Statements under Item 8 for
additional information.
(2) Canada, Latin America and South America
(3) Europe, the Middle East and Africa (‘‘EMEA’’)
(4) Asia-Pacific (‘‘APAC’’)
68