Lenovo 2008 Annual Report Download - page 82
Download and view the complete annual report
Please find page 82 of the 2008 Lenovo annual report below. You can navigate through the pages in the report by either clicking on the pages listed below, or by using the keyword search tool below to find specific information within the annual report.-
 1
1 -
2
-
3
-
4
-
5
-
6
-
7
-
8
-
9
-
10
-
11
-
12
-
13
-
14
-
15
-
16
-
17
-
18
-
19
-
20
-
21
-
22
-
23
-
24
-
25
-
26
-
27
-
28
-
29
-
30
-
31
-
32
-
33
-
34
-
35
-
36
-
37
-
38
-
39
-
40
-
41
-
42
-
43
-
44
-
45
-
46
-
47
-
48
-
49
-
50
-
51
-
52
-
53
-
54
-
55
-
56
-
57
-
58
-
59
-
60
-
61
-
62
-
63
-
64
-
65
-
66
-
67
-
68
-
69
-
70
-
71
-
 72
72 -
 73
73 -
 74
74 -
 75
75 -
 76
76 -
 77
77 -
 78
78 -
 79
79 -
 80
80 -
 81
81 -
 82
82 -
 83
83 -
 84
84 -
 85
85 -
 86
86 -
 87
87 -
 88
88 -
 89
89 -
 90
90 -
 91
91 -
 92
92 -
93
-
94
-
95
-
96
-
97
-
98
-
99
-
100
-
101
-
102
-
103
-
104
-
105
-
106
-
107
-
108
-
109
-
110
-
111
-
112
-
113
-
114
-
115
-
116
-
117
-
118
-
119
-
120
-
121
-
122
-
123
-
124
-
125
-
126
-
127
-
128
-
129
-
130
-
131
-
132
-
133
-
134
-
135
-
136
-
137
-
138
-
139
-
140
-
141
-
142
-
143
-
144
-
145
-
146
-
147
-
148
 |
 |

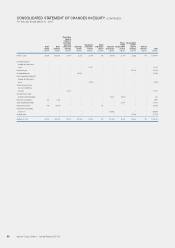
CONSOLIDATED STATEMENT OF CHANGES IN EQUITY (CONTINUED)
For the year ended March 31, 2007
Share
capital
Share
premium
Convertible
rights in
respect of
convertible
preferred
shares and
warrants
Exchange
reserve
Investment
revaluation
reserve
Share
redemption
reserve
Employee
share trusts
Share-
based
compensation
reserve
(Accumulated
losses)/
retained
earnings
Minority
interests Total
US$’000 US$’000 US$’000 US$’000 US$’000 US$’000 US$’000 US$’000 US$’000 US$’000 US$’000
At April 1, 2006 28,504 1,043,260 10,769 (3,313) (3,579) 396 (51,043) 22,791 (3,882) 744 1,044,647
Fair value change on
available-for-sale financial
assets – – – – 21,560 –––––21,560
Profit for the year ––––––––161,13 8 –161,13 8
Exchange differences –––(19,443) ––––––(19,443)
Reserve realized on disposal of
available-for-sale financial
assets – – – – (2,903) –––––(2,903)
Transfer of warrants from
non-current liabilities at
fair value – – 35,210 –––––––35,210
Vesting of shares under
long-term incentive program – – – – – – 8,634 (8,372) – – 262
Exercise of share options 101 9,764 ––––––––9,865
Share-based compensation –––––––37,0 01 – – 3 7,0 0 1
Repurchase of shares (101) (10,445) –––101 ––––(10,445)
Contributions to employee
share trusts – – – – – – (84,892) –––(84,892)
Dividends paid – – – – – – – – (57,724) –(57,724)
At March 31, 2007 28,504 1,042,579 45,979 (22,756) 15,078 497 ( 12 7, 3 01) 51,420 99,532 74 4 1,134, 276
Lenovo Group Limited • Annual Report 2007/08
80