Lenovo 2008 Annual Report Download - page 141
Download and view the complete annual report
Please find page 141 of the 2008 Lenovo annual report below. You can navigate through the pages in the report by either clicking on the pages listed below, or by using the keyword search tool below to find specific information within the annual report.-
 1
1 -
2
-
3
-
4
-
5
-
6
-
7
-
8
-
9
-
10
-
11
-
12
-
13
-
14
-
15
-
16
-
17
-
18
-
19
-
20
-
21
-
22
-
23
-
24
-
25
-
26
-
27
-
28
-
29
-
30
-
31
-
32
-
33
-
34
-
35
-
36
-
37
-
38
-
39
-
40
-
41
-
42
-
43
-
44
-
45
-
46
-
47
-
48
-
49
-
50
-
51
-
52
-
53
-
54
-
55
-
56
-
57
-
58
-
59
-
60
-
61
-
62
-
63
-
64
-
65
-
66
-
67
-
68
-
69
-
70
-
71
-
72
-
73
-
74
-
75
-
76
-
77
-
78
-
79
-
80
-
81
-
82
-
83
-
84
-
85
-
86
-
87
-
88
-
89
-
90
-
91
-
92
-
93
-
94
-
95
-
96
-
97
-
98
-
99
-
100
-
101
-
102
-
103
-
104
-
105
-
106
-
107
-
108
-
109
-
110
-
111
-
112
-
113
-
114
-
115
-
116
-
117
-
118
-
119
-
120
-
121
-
122
-
123
-
124
-
125
-
126
-
127
-
128
-
129
-
130
-
 131
131 -
 132
132 -
 133
133 -
 134
134 -
 135
135 -
 136
136 -
 137
137 -
 138
138 -
 139
139 -
 140
140 -
 141
141 -
 142
142 -
 143
143 -
 144
144 -
 145
145 -
 146
146 -
 147
147 -
 148
148
 |
 |

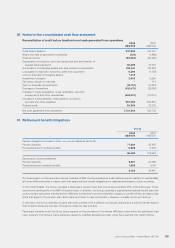
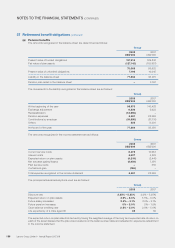
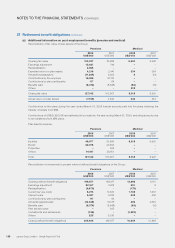
37 Retirement benefit obligations (continued)
(c) Additional information on post-employment benefits (pension and medical) (continued)
Summary of pensions and post-retirement medical benefits
Group
2008 2007
US$’000 US$’000
Present value of defined benefit obligations 220,650 213,775
Fair value of plan assets 135,160 110,827
Deficit 85,490 102,948
Experience adjustments on plan assets
Amount of gain (11,384) (2,152)
Percentage of the fair value of plan assets 8.4% 1.9%
Experience adjustments on plan liabilities
Amount of losses 10,081 8,040
Percentage of the present value of the defined benefit obligations 4.6% 4.0%
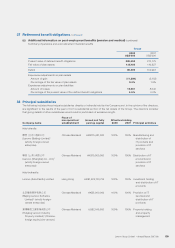
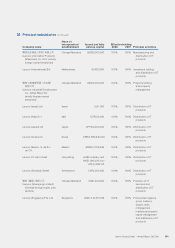
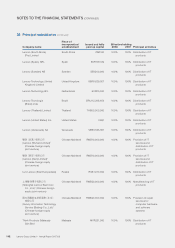
38 Principal subsidiaries
The following includes the principal subsidiaries directly or indirectly held by the Company and, in the opinion of the directors,
are significant to the results of the year or form a substantial portion of the net assets of the Group. The directors consider
that giving details of other subsidiaries would result in particulars of excessive length.
Company name
Place of
incorporation/
establishment
Issued and fully
paid up capital
Effective holding
Principal activities2008 2007
Held directly:
聯想(北京)有限公司
(Lenovo (Beijing) Limited)1
(wholly foreign-owned
enterprise)
Chinese Mainland HK$175,481,30 0 100% 100% Manufacturing and
distribution of
IT products and
provision of IT
services
聯想(上海)有限公司
(Lenovo (Shanghai) Co., Ltd.)1
(wholly foreign-owned
enterprise)
Chinese Mainland HK$10,000,000 100% 100% Distribution of IT
products and
provision of IT
services
Held indirectly:
Lenovo (Asia Pacific) Limited Hong Kong H K$1,225,13 0,73 4 100% 100% Investment holding
and distribution of IT
products
北京聯想軟件有限公司
(Beijing Lenovo Software
Limited)1 (wholly foreign-
owned enterprise)
Chinese Mainland HK$5,000,000 100% 100% Provision of IT
services and
distribution of IT
products
惠陽聯想工業物業有限公司
(Huiyang Lenovo Industry
Property Limited)1 (Chinese-
foreign equity joint venture)
Chinese Mainland US$2,045,500 100% 100% Property holding
and property
management
Lenovo Group Limited • Annual Report 2007/08 139