Lenovo 2008 Annual Report Download - page 4
Download and view the complete annual report
Please find page 4 of the 2008 Lenovo annual report below. You can navigate through the pages in the report by either clicking on the pages listed below, or by using the keyword search tool below to find specific information within the annual report.-
 1
1 -
 2
2 -
 3
3 -
 4
4 -
 5
5 -
 6
6 -
 7
7 -
 8
8 -
 9
9 -
 10
10 -
 11
11 -
 12
12 -
 13
13 -
 14
14 -
 15
15 -
16
-
17
-
18
-
19
-
20
-
21
-
22
-
23
-
24
-
25
-
26
-
27
-
28
-
29
-
30
-
31
-
32
-
33
-
34
-
35
-
36
-
37
-
38
-
39
-
40
-
41
-
42
-
43
-
44
-
45
-
46
-
47
-
48
-
49
-
50
-
51
-
52
-
53
-
54
-
55
-
56
-
57
-
58
-
59
-
60
-
61
-
62
-
63
-
64
-
65
-
66
-
67
-
68
-
69
-
70
-
71
-
72
-
73
-
74
-
75
-
76
-
77
-
78
-
79
-
80
-
81
-
82
-
83
-
84
-
85
-
86
-
87
-
88
-
89
-
90
-
91
-
92
-
93
-
94
-
95
-
96
-
97
-
98
-
99
-
100
-
101
-
102
-
103
-
104
-
105
-
106
-
107
-
108
-
109
-
110
-
111
-
112
-
113
-
114
-
115
-
116
-
117
-
118
-
119
-
120
-
121
-
122
-
123
-
124
-
125
-
126
-
127
-
128
-
129
-
130
-
131
-
132
-
133
-
134
-
135
-
136
-
137
-
138
-
139
-
140
-
141
-
142
-
143
-
144
-
145
-
146
-
147
-
148
 |
 |

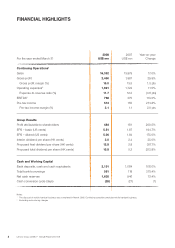
2Lenovo Group Limited • Annual Report 2007/08
FINANCIAL HIGHLIGHTS
2008 2007 Year-on-year
For the year ended March 31 US$ mn US$ mn Change
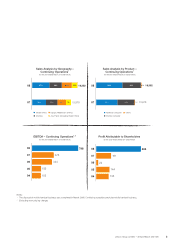
Continuing Operations1
Sales 16,352 13,978 17.0%
Gross profit 2,450 1,887 29.8%
Gross profit margin (%) 15.0 13.5 1.5 pts
Operating expenses21,921 1,722 11.5%
Expense-to-revenue ratio (%) 11.7 12.3 (0.6 pts)
EBITDA2798 375 113.0%
Pre-tax income 513 155 231.8%
Pre-tax income margin (%) 3.1 1.1 2.0 pts
Group Results
Profit attributable to shareholders 484 161 200.5%
EPS – basic (US cents) 5.51 1.87 194.7%
EPS – diluted (US cents) 5.06 1.84 175.0%
Interim dividend per share (HK cents) 3.0 2.4 25.0%
Proposed final dividend per share (HK cents) 12.8 2.8 357.1%
Proposed total dividend per share (HK cents) 15.8 5.2 203.8%
Cash and Working Capital
Bank deposits, cash and cash equivalents 2,191 1,064 106.0%
Total bank borrowings 561 118 375.4%
Net cash reserves 1,630 946 72.4%
Cash conversion cycle (days) (28) (27) (1)
Notes:
1 The disposal of mobile handset business was completed in March 2008. Continuing operations exclude mobile handset business.
2 Excluding restructuring charges