Lenovo 2008 Annual Report Download - page 146
Download and view the complete annual report
Please find page 146 of the 2008 Lenovo annual report below. You can navigate through the pages in the report by either clicking on the pages listed below, or by using the keyword search tool below to find specific information within the annual report.-
 1
1 -
2
-
3
-
4
-
5
-
6
-
7
-
8
-
9
-
10
-
11
-
12
-
13
-
14
-
15
-
16
-
17
-
18
-
19
-
20
-
21
-
22
-
23
-
24
-
25
-
26
-
27
-
28
-
29
-
30
-
31
-
32
-
33
-
34
-
35
-
36
-
37
-
38
-
39
-
40
-
41
-
42
-
43
-
44
-
45
-
46
-
47
-
48
-
49
-
50
-
51
-
52
-
53
-
54
-
55
-
56
-
57
-
58
-
59
-
60
-
61
-
62
-
63
-
64
-
65
-
66
-
67
-
68
-
69
-
70
-
71
-
72
-
73
-
74
-
75
-
76
-
77
-
78
-
79
-
80
-
81
-
82
-
83
-
84
-
85
-
86
-
87
-
88
-
89
-
90
-
91
-
92
-
93
-
94
-
95
-
96
-
97
-
98
-
99
-
100
-
101
-
102
-
103
-
104
-
105
-
106
-
107
-
108
-
109
-
110
-
111
-
112
-
113
-
114
-
115
-
116
-
117
-
118
-
119
-
120
-
121
-
122
-
123
-
124
-
125
-
126
-
127
-
128
-
129
-
130
-
131
-
132
-
133
-
134
-
135
-
 136
136 -
 137
137 -
 138
138 -
 139
139 -
 140
140 -
 141
141 -
 142
142 -
 143
143 -
 144
144 -
 145
145 -
 146
146 -
 147
147 -
 148
148
 |
 |

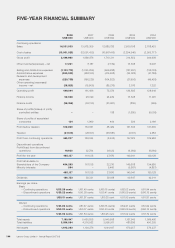
FIVE-YEAR FINANCIAL SUMMARY
Lenovo Group Limited • Annual Report 2007/08
144
2008 2007 2006 2005 2004
US$’000 US$’000 US$’000 US$’000 US$’000
Continuing operations
Sales 16,351,503 13,978,309 12,685,726 2,609,198 2,708,433
Cost of sales (13,901,523) (12,091,433) (10, 9 67,415 ) (2,294,346) (2,363,777)
Gross profit 2,449,980 1,886,876 1,718,311 314,852 344,656
Other income/(expenses) – net 17,261 8,187 ( 7, 73 9 ) 13,538 6,097
Selling and distribution expenses (1,103,713) (1,033,296) (969,288) (12 7, 2 07 ) (138,10 3)
Administrative expenses (595,902) (488,150) (415,608) (35,382) (41,788)
Research and development
expenses (229,759) (196,225) (164,822) (2 7,9 9 2) (49,438)
Other operating (expenses)/
income – net (38,823) (15,906) (85,275) 2,076 7, 2 2 2
Operating profit 499,044 161,486 75,579 139,885 128,646
Finance income 52,048 26,329 24,229 13,548 11,970
Finance costs (38,366) (3 5,133) (51,981) (855) (369)
Share of profits/(losses) of jointly
controlled entities ––138 (1,580) (5,008)
Share of profits of associated
companies 124 1,869 464 536 2,16 6
Profit before taxation 512,850 154,551 48,429 151,534 13 7,4 0 5
Taxation (47,613) (26,197 ) (56,881) (4,511) 2,583
Profit from continuing operations 465,237 128,354 (8,452) 147, 0 23 139,988
Discontinued operations
Profit/(loss) from discontinued
operations 19,920 32,784 3 6,122 (6,982) (9,860)
Profit for the year 485,157 161,138 2 7, 670 140,041 13 0,128
Profit attributable to:
Shareholders of the Company 484,263 161,138 22,210 143,608 134,985
Minority interests 894 –5,460 (3,567) (4,857)
485,157 161,13 8 2 7, 670 140,041 13 0,128
Dividends 186,753 59,331 59,198 49,847 42,911
Earnings per share
Basic
– Continuing operations US5.29 cents US1.49 cents (US0.16 cents) US2.02 cents US1.94 cents
– Discontinued operations US0.22 cents US0.38 cents US0.41 cents (US0.09 cents) (US0.13 cents)
US5.51 cents US1.87 cents US0.25 cent US1.93 cents US1.81 cents
Diluted
– Continuing operations US4.86 cents US1.47 cents (US0.15 cents) US2.01 cents US1.92 cents
– Discontinued operations US0.20 cents US0.37 cents US0.40 cents (US0.09 cents) (US0.13 cents)
US5.06 cents US1.84 cents US0.25 cent US1.92 cents US1.79 cents
Total assets 7,19 9,847 5,450,838 5,040,558 1,15 7, 9 4 3 1,069,492
Total liabilities 5,586,584 4,316,562 3,995,911 487,686 490,255
Net assets 1,613,263 1,134,276 1,044,647 670,257 579,237