Lenovo 2008 Annual Report Download - page 102
Download and view the complete annual report
Please find page 102 of the 2008 Lenovo annual report below. You can navigate through the pages in the report by either clicking on the pages listed below, or by using the keyword search tool below to find specific information within the annual report.-
 1
1 -
2
-
3
-
4
-
5
-
6
-
7
-
8
-
9
-
10
-
11
-
12
-
13
-
14
-
15
-
16
-
17
-
18
-
19
-
20
-
21
-
22
-
23
-
24
-
25
-
26
-
27
-
28
-
29
-
30
-
31
-
32
-
33
-
34
-
35
-
36
-
37
-
38
-
39
-
40
-
41
-
42
-
43
-
44
-
45
-
46
-
47
-
48
-
49
-
50
-
51
-
52
-
53
-
54
-
55
-
56
-
57
-
58
-
59
-
60
-
61
-
62
-
63
-
64
-
65
-
66
-
67
-
68
-
69
-
70
-
71
-
72
-
73
-
74
-
75
-
76
-
77
-
78
-
79
-
80
-
81
-
82
-
83
-
84
-
85
-
86
-
87
-
88
-
89
-
90
-
91
-
 92
92 -
 93
93 -
 94
94 -
 95
95 -
 96
96 -
 97
97 -
 98
98 -
 99
99 -
 100
100 -
 101
101 -
 102
102 -
 103
103 -
 104
104 -
 105
105 -
 106
106 -
 107
107 -
 108
108 -
 109
109 -
 110
110 -
 111
111 -
 112
112 -
113
-
114
-
115
-
116
-
117
-
118
-
119
-
120
-
121
-
122
-
123
-
124
-
125
-
126
-
127
-
128
-
129
-
130
-
131
-
132
-
133
-
134
-
135
-
136
-
137
-
138
-
139
-
140
-
141
-
142
-
143
-
144
-
145
-
146
-
147
-
148
 |
 |

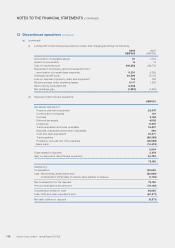
NOTES TO THE FINANCIAL STATEMENTS (CONTINUED)
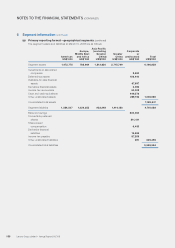
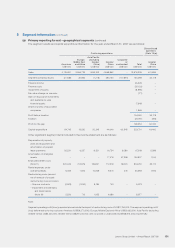
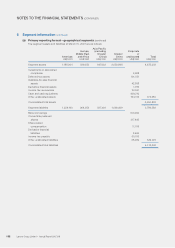
5 Segment information (continued)
(a) Primary reporting format – geographical segments (continued)
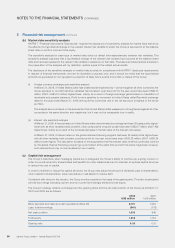
The segment assets and liabilities at March 31, 2008 are as follows:
Americas
Europe,
Middle East
and Africa
Asia Pacific
(excluding
Greater
China)
Greater
China
Corporate
or
unallocated Total
US$’000 US$’000 US$’000 US$’000 US$’000 US$’000
Segment assets 1,472,775 788,664 1,213,620 2,715,799 6,190,858
Investments in associated
companies 2,690
Deferred tax assets 156,440
Available-for-sale financial
assets 67,697
Derivative financial assets 3,392
Income tax recoverable 40,002
Cash and cash equivalents 449,576
Other unallocated assets 289,192 1,008,989
Consolidated total assets 7,199,8 47
Segment liabilities 1,384,307 1,029,253 933,348 1,414,180 4,761,088
Bank borrowings 500,000
Convertible preferred
shares 211,181
Share-based
compensation 6,430
Derivative financial
liabilities 19,985
Income tax payable 87,2 0 9
Other unallocated liabilities 691 825,496
Consolidated total liabilities 5,586,584
Lenovo Group Limited • Annual Report 2007/08
100