Lenovo 2008 Annual Report Download - page 134
Download and view the complete annual report
Please find page 134 of the 2008 Lenovo annual report below. You can navigate through the pages in the report by either clicking on the pages listed below, or by using the keyword search tool below to find specific information within the annual report.-
 1
1 -
2
-
3
-
4
-
5
-
6
-
7
-
8
-
9
-
10
-
11
-
12
-
13
-
14
-
15
-
16
-
17
-
18
-
19
-
20
-
21
-
22
-
23
-
24
-
25
-
26
-
27
-
28
-
29
-
30
-
31
-
32
-
33
-
34
-
35
-
36
-
37
-
38
-
39
-
40
-
41
-
42
-
43
-
44
-
45
-
46
-
47
-
48
-
49
-
50
-
51
-
52
-
53
-
54
-
55
-
56
-
57
-
58
-
59
-
60
-
61
-
62
-
63
-
64
-
65
-
66
-
67
-
68
-
69
-
70
-
71
-
72
-
73
-
74
-
75
-
76
-
77
-
78
-
79
-
80
-
81
-
82
-
83
-
84
-
85
-
86
-
87
-
88
-
89
-
90
-
91
-
92
-
93
-
94
-
95
-
96
-
97
-
98
-
99
-
100
-
101
-
102
-
103
-
104
-
105
-
106
-
107
-
108
-
109
-
110
-
111
-
112
-
113
-
114
-
115
-
116
-
117
-
118
-
119
-
120
-
121
-
122
-
123
-
 124
124 -
 125
125 -
 126
126 -
 127
127 -
 128
128 -
 129
129 -
 130
130 -
 131
131 -
 132
132 -
 133
133 -
 134
134 -
 135
135 -
 136
136 -
 137
137 -
 138
138 -
 139
139 -
 140
140 -
 141
141 -
 142
142 -
 143
143 -
 144
144 -
145
-
146
-
147
-
148
 |
 |

NOTES TO THE FINANCIAL STATEMENTS (CONTINUED)
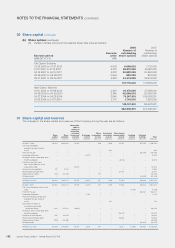
30 Share capital (continued)
(b) Share options (continued)
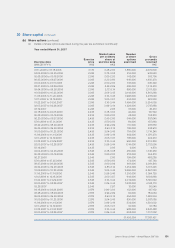
(iii) Details of share options at the balance sheet date were as follows:
2008 2007
Exercise period
Exercise
price
Number of
outstanding
share options
Number of
outstanding
share options
(MM.DD.YYYY) HK$
Old Option Scheme
01.28.2000 to 01.27.2010 4.038 6,696,000 7,712,0 0 0
01.15.2001 to 01.14.2011 4.312 55,012,000 74,480,000
04.16.20 01 to 04.15.2011 4.072 30,822,000 35,550,000
08.29.2001 to 08.28.2011 2.904 832,000 832,000
08.31.2001 to 08.30.2011 2.876 44,416,000 59,414,000
137,778,000 17 7,9 8 8 ,0 0 0
New Option Scheme
10.10.2002 to 10.09.2012 2.435 21,478,000 27, 38 8 ,0 0 0
04.26.2003 to 04.25.2013 2.245 42,596,000 55,436,000
04.27.2004 to 04.26.2014 2.545 79,367,051 105,063,601
07.08.2004 to 07.07.2014 2.170 1,740,000 7,520,000
145,181,051 195,407,601
282,959,051 373,395,601
31 Share capital and reserves
The changes in the share capital and reserves of the Company during the year are as follows:
Share
capital
Share
premium
Convertible
rights in
respect of
convertible
preferred
shares and
warrants
Exchange
reserve
Share
redemption
reserve
Investment
revaluation
reserve
Share-based
compensation
reserve
Hedging
reserve
Retained
earnings Total
US$’000 US$’000 US$’000 US$’000 US$’000 US$’000 US$’000 US$’000 US$’000 US$’000
At April 1, 2006 28,504 1,043,260 10,769 –396 (619) 22,791 –325,193 1,430,294
Fair value change on
available-for-sale financial
assets –––––438 –––438
Profit for the year –––––– ––128,499 128,499
Exchange differences –––(2,497) –– –––(2,497)
Vesting of shares under long-term
incentive program ––––––(8,372) – – (8,372)
Transfer of warrants from
non-current liabilities at fair
value
(Note 29(d))
– – 35,210 ––– –––35,210
Exercise of share options 101 9,764 –––– –––9,865
Share-based compensation ––––––37, 0 01 – – 3 7, 0 01
Repurchase of shares (101) (10,445) – – 101 – – – – (10,445)
Dividends paid –––––– ––(59,449) (59,449)
At March 31, 2007 28,504 1,042,579 45,979 (2,497) 497 (181) 51,420 –394,243 1,560,544
At April 1, 2007 28,504 1,042,579 45,979 (2,497) 497 (181) 51,420 –394,243 1,560,544
Fair value change on interest rate
swap –––––– –(1,788) –(1,788)
Profit for the year –––––– ––466,767 466,767
Exchange differences –––5,74 3 –– –––5,743
Reserve realized on disposal of
available-for-sale financial
assets –––––181 –––181
Conversion of Series A
cumulative convertible
preferred shares 1,130 115 ,924 (3,820) ––– –––113,23 4
Vesting of shares under long-term
incentive program ––––––(26,011) – – (26 ,011)
Exercise of share options 290 34,539 –––– –––34,829
Share-based compensation ––––––53,328 – – 53,328
Repurchase of shares (225) (42,358) –––– –––(42,583)
Dividends paid –––––– ––(68,076) (68,076)
At March 31, 2008 29,699 1,15 0,6 8 4 42,15 9 3,246 497 –78,737 (1,788) 792,934 2,09 6,168
Lenovo Group Limited • Annual Report 2007/08
132