Lenovo 2008 Annual Report Download - page 104
Download and view the complete annual report
Please find page 104 of the 2008 Lenovo annual report below. You can navigate through the pages in the report by either clicking on the pages listed below, or by using the keyword search tool below to find specific information within the annual report.-
 1
1 -
2
-
3
-
4
-
5
-
6
-
7
-
8
-
9
-
10
-
11
-
12
-
13
-
14
-
15
-
16
-
17
-
18
-
19
-
20
-
21
-
22
-
23
-
24
-
25
-
26
-
27
-
28
-
29
-
30
-
31
-
32
-
33
-
34
-
35
-
36
-
37
-
38
-
39
-
40
-
41
-
42
-
43
-
44
-
45
-
46
-
47
-
48
-
49
-
50
-
51
-
52
-
53
-
54
-
55
-
56
-
57
-
58
-
59
-
60
-
61
-
62
-
63
-
64
-
65
-
66
-
67
-
68
-
69
-
70
-
71
-
72
-
73
-
74
-
75
-
76
-
77
-
78
-
79
-
80
-
81
-
82
-
83
-
84
-
85
-
86
-
87
-
88
-
89
-
90
-
91
-
92
-
93
-
 94
94 -
 95
95 -
 96
96 -
 97
97 -
 98
98 -
 99
99 -
 100
100 -
 101
101 -
 102
102 -
 103
103 -
 104
104 -
 105
105 -
 106
106 -
 107
107 -
 108
108 -
 109
109 -
 110
110 -
 111
111 -
 112
112 -
 113
113 -
 114
114 -
115
-
116
-
117
-
118
-
119
-
120
-
121
-
122
-
123
-
124
-
125
-
126
-
127
-
128
-
129
-
130
-
131
-
132
-
133
-
134
-
135
-
136
-
137
-
138
-
139
-
140
-
141
-
142
-
143
-
144
-
145
-
146
-
147
-
148
 |
 |

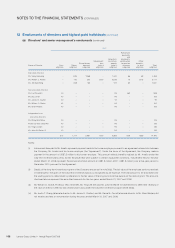
NOTES TO THE FINANCIAL STATEMENTS (CONTINUED)
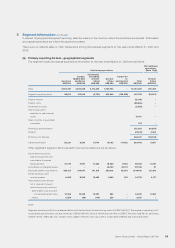
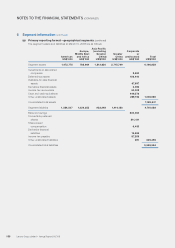
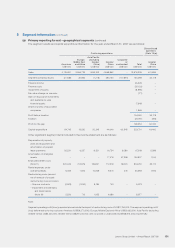
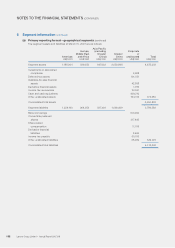
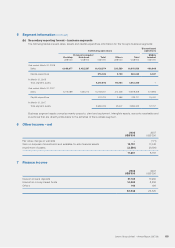
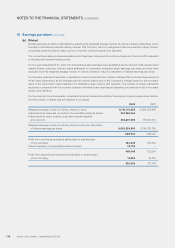
5 Segment information (continued)
(a) Primary reporting format – geographical segments (continued)
The segment assets and liabilities at March 31, 2007 are as follows:
Americas
Europe,
Middle East
and Africa
Asia Pacific
(excluding
Greater
China)
Greater
China
Corporate
or
unallocated Total
US$’000 US$’000 US$’000 US$’000 US$’000 US$’000
Segment assets 1,188,004 589,350 8 47, 0 3 8 2,050,866 4,675,258
Investments in associated
companies 3,908
Deferred tax assets 101,551
Available-for-sale financial
assets 42,938
Derivative financial assets 1,616
Income tax recoverable 22,041
Cash and cash equivalents 439,212
Other unallocated assets 164,314 775,580
Consolidated total assets 5,450,838
Segment liabilities 1,228,16 0 904,054 587,436 1,066,939 3,786,589
Bank borrowings 100,000
Convertible preferred
shares 317, 4 9 5
Share-based
compensation 11,019
Derivative financial
liabilities 2,464
Income tax payable 60,013
Other unallocated liabilities 38,982 529,973
Consolidated total liabilities 4,316,562
Lenovo Group Limited • Annual Report 2007/08
102