Lenovo 2008 Annual Report Download - page 105
Download and view the complete annual report
Please find page 105 of the 2008 Lenovo annual report below. You can navigate through the pages in the report by either clicking on the pages listed below, or by using the keyword search tool below to find specific information within the annual report.-
 1
1 -
2
-
3
-
4
-
5
-
6
-
7
-
8
-
9
-
10
-
11
-
12
-
13
-
14
-
15
-
16
-
17
-
18
-
19
-
20
-
21
-
22
-
23
-
24
-
25
-
26
-
27
-
28
-
29
-
30
-
31
-
32
-
33
-
34
-
35
-
36
-
37
-
38
-
39
-
40
-
41
-
42
-
43
-
44
-
45
-
46
-
47
-
48
-
49
-
50
-
51
-
52
-
53
-
54
-
55
-
56
-
57
-
58
-
59
-
60
-
61
-
62
-
63
-
64
-
65
-
66
-
67
-
68
-
69
-
70
-
71
-
72
-
73
-
74
-
75
-
76
-
77
-
78
-
79
-
80
-
81
-
82
-
83
-
84
-
85
-
86
-
87
-
88
-
89
-
90
-
91
-
92
-
93
-
94
-
 95
95 -
 96
96 -
 97
97 -
 98
98 -
 99
99 -
 100
100 -
 101
101 -
 102
102 -
 103
103 -
 104
104 -
 105
105 -
 106
106 -
 107
107 -
 108
108 -
 109
109 -
 110
110 -
 111
111 -
 112
112 -
 113
113 -
 114
114 -
 115
115 -
116
-
117
-
118
-
119
-
120
-
121
-
122
-
123
-
124
-
125
-
126
-
127
-
128
-
129
-
130
-
131
-
132
-
133
-
134
-
135
-
136
-
137
-
138
-
139
-
140
-
141
-
142
-
143
-
144
-
145
-
146
-
147
-
148
 |
 |

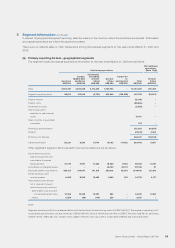
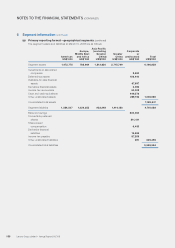
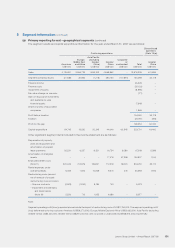
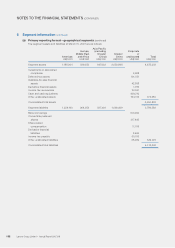
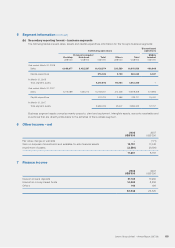
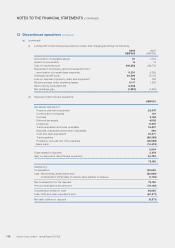
5 Segment information (continued)
(b) Secondary reporting format – business segments
The following tables present sales, assets and capital expenditure information for the Group’s business segments:
Continuing operations
Discontinued
operations
Personal computer Mobile
Desktop Notebook Total Others Total handset
US$’000 US$’000 US$’000 US$’000 US$’000 US$’000
Year ended March 31, 2008
Sales 6,698,677 9,422,297 16,120,974 230,529 16,351,503 436,369
Capital expenditure 278,334 5,709 284,043 5,837
At March 31, 2008
Total segment assets 4,397,096 115,144 4,512,240 –
Year ended March 31, 2007
Sales 6,115,0 89 7, 6 5 3 ,17 2 13,768,261 210,048 13,978,309 611,895
Capital expenditure 221,213 2,488 223,701 19,400
At March 31, 2007
Total segment assets 3,938,006 45,237 3,983,243 91,757
Business segment assets comprise mainly property, plant and equipment, intangible assets, accounts receivable and
inventories that are directly attributable to the activities of the business segment.
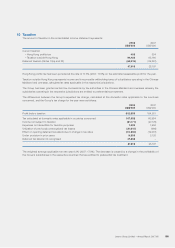
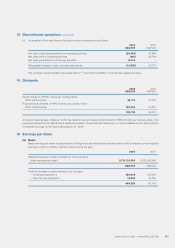
6 Other income – net
2008 2007
US$’000 US$’000
Fair value change on warrants –(171)
Gain on disposal of investments and available-for-sale financial assets 19,791 17, 3 4 8
Impairment of assets (2,530) (8,990)
17, 261 8,187
7 Finance income
2008 2007
US$’000 US$’000
Interest on bank deposits 37,100 17,9 6 2
Interest on money market funds 14,808 8,258
Others 140 109
52,048 26,329
Lenovo Group Limited • Annual Report 2007/08 103