Lenovo 2008 Annual Report Download - page 103
Download and view the complete annual report
Please find page 103 of the 2008 Lenovo annual report below. You can navigate through the pages in the report by either clicking on the pages listed below, or by using the keyword search tool below to find specific information within the annual report.-
 1
1 -
2
-
3
-
4
-
5
-
6
-
7
-
8
-
9
-
10
-
11
-
12
-
13
-
14
-
15
-
16
-
17
-
18
-
19
-
20
-
21
-
22
-
23
-
24
-
25
-
26
-
27
-
28
-
29
-
30
-
31
-
32
-
33
-
34
-
35
-
36
-
37
-
38
-
39
-
40
-
41
-
42
-
43
-
44
-
45
-
46
-
47
-
48
-
49
-
50
-
51
-
52
-
53
-
54
-
55
-
56
-
57
-
58
-
59
-
60
-
61
-
62
-
63
-
64
-
65
-
66
-
67
-
68
-
69
-
70
-
71
-
72
-
73
-
74
-
75
-
76
-
77
-
78
-
79
-
80
-
81
-
82
-
83
-
84
-
85
-
86
-
87
-
88
-
89
-
90
-
91
-
92
-
 93
93 -
 94
94 -
 95
95 -
 96
96 -
 97
97 -
 98
98 -
 99
99 -
 100
100 -
 101
101 -
 102
102 -
 103
103 -
 104
104 -
 105
105 -
 106
106 -
 107
107 -
 108
108 -
 109
109 -
 110
110 -
 111
111 -
 112
112 -
 113
113 -
114
-
115
-
116
-
117
-
118
-
119
-
120
-
121
-
122
-
123
-
124
-
125
-
126
-
127
-
128
-
129
-
130
-
131
-
132
-
133
-
134
-
135
-
136
-
137
-
138
-
139
-
140
-
141
-
142
-
143
-
144
-
145
-
146
-
147
-
148
 |
 |

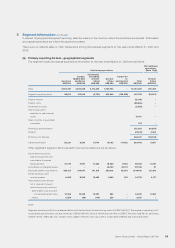
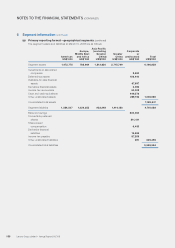
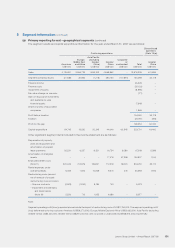
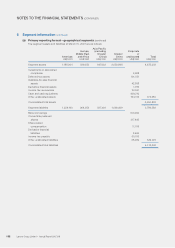
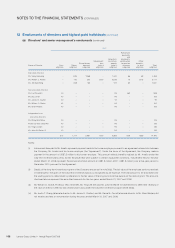
5 Segment information (continued)
(a) Primary reporting format – geographical segments (continued)
The segment results and capital expenditure information for the year ended March 31, 2007 are as follows:
Continuing operations
Discontinued
operatons
(Note 13(a))
Americas
Europe,
Middle East
and Africa
Asia Pacific
(excluding
Greater
China)
Greater
China
Corporate
or
unallocated Total
Greater
China
US$’000 US$’000 US$’000 US$’000 US$’000 US$’000 US$’000
Sales 4,119,481 3,056,723 1,833,243 4,968,862 –13,978,309 611,895
Segment operating results ( 2 7, 5 3 8) 25,856 (1,278) 294,150 (13 7, 8 91) 153,299 33,178
Finance income 26,329 –
Finance costs (35,13 3) –
Impairment of assets (8,990) –
Fair value change on warrants (171) –
Gain on disposal of investments
and available-for-sale
financial assets 17, 3 4 8 –
Share of profits of associated
companies 1,869 –
Profit before taxation 154,551 33,178
Taxation (26,197 ) (394)
Profit for the year 128,354 32,784
Capital expenditure 8 4,745 13,520 20,245 44,646 60,545 223,701 19,400
Other significant segment items included in the income statement are as follows:
Depreciation of property,
plant and equipment and
amortization of prepaid
lease payments 32,231 6,257 9,521 16,724 3,086 67, 819 5,389
Amortization of intangible
assets – – – 17, 47 8 8 7, 3 59 104,837 1,154
Employee benefit costs
(Note 11) 320,442 214,979 136,837 172,319 59,674 904,251 5 5,174
Rental expenses under
operating leases 6,469 7, 0 0 6 10,069 9,374 475 33,393 1,916
Restructuring costs (amount
net of reversal of unused
restructuring costs provision)
– Onerous contracts (2,922) (1,032) 9,18 4 743 –5,973 –
– Impairment of trademarks
and trade names
(Note 19) 2,526 713 1,052 4,686 –8,977 –
Note:
Segment operating profit/(loss) presented above include the impact of restructuring costs of US$11,794,000. The segment operating profit /
(loss) before restructuring costs are: Americas (US$29,270,000); Europe, Middle East and Africa US$20,633,000; Asia Pacific (excluding
Greater China) US$5,403,000; Greater China US$297,240,000; and corporate or unallocated (US$128,913,000) respectively.
Lenovo Group Limited • Annual Report 2007/08 101