Lenovo 2008 Annual Report Download - page 101
Download and view the complete annual report
Please find page 101 of the 2008 Lenovo annual report below. You can navigate through the pages in the report by either clicking on the pages listed below, or by using the keyword search tool below to find specific information within the annual report.-
 1
1 -
2
-
3
-
4
-
5
-
6
-
7
-
8
-
9
-
10
-
11
-
12
-
13
-
14
-
15
-
16
-
17
-
18
-
19
-
20
-
21
-
22
-
23
-
24
-
25
-
26
-
27
-
28
-
29
-
30
-
31
-
32
-
33
-
34
-
35
-
36
-
37
-
38
-
39
-
40
-
41
-
42
-
43
-
44
-
45
-
46
-
47
-
48
-
49
-
50
-
51
-
52
-
53
-
54
-
55
-
56
-
57
-
58
-
59
-
60
-
61
-
62
-
63
-
64
-
65
-
66
-
67
-
68
-
69
-
70
-
71
-
72
-
73
-
74
-
75
-
76
-
77
-
78
-
79
-
80
-
81
-
82
-
83
-
84
-
85
-
86
-
87
-
88
-
89
-
90
-
 91
91 -
 92
92 -
 93
93 -
 94
94 -
 95
95 -
 96
96 -
 97
97 -
 98
98 -
 99
99 -
 100
100 -
 101
101 -
 102
102 -
 103
103 -
 104
104 -
 105
105 -
 106
106 -
 107
107 -
 108
108 -
 109
109 -
 110
110 -
 111
111 -
112
-
113
-
114
-
115
-
116
-
117
-
118
-
119
-
120
-
121
-
122
-
123
-
124
-
125
-
126
-
127
-
128
-
129
-
130
-
131
-
132
-
133
-
134
-
135
-
136
-
137
-
138
-
139
-
140
-
141
-
142
-
143
-
144
-
145
-
146
-
147
-
148
 |
 |

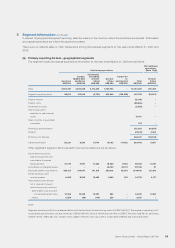
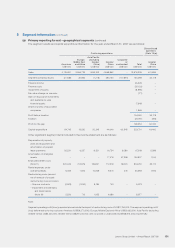
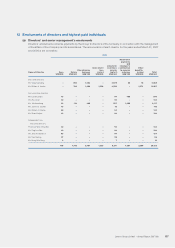
5 Segment information (continued)
In respect of geographical segment reporting, sales are based on the country in which the customers are located. Total assets
and capital expenditure are where the assets are located.
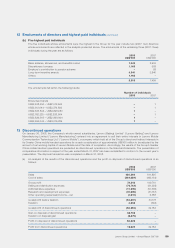
There were no material sales or other transactions among the business segments for the years ended March 31, 2007 and
2008.
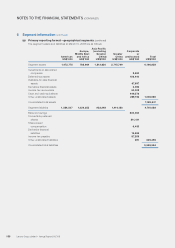
(a) Primary reporting format – geographical segments
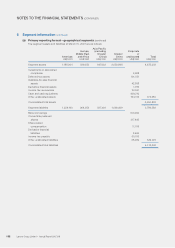
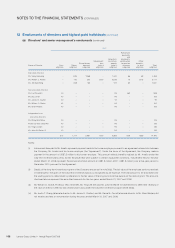
The segment results and capital expenditure information for the year ended March 31, 2008 are as follows:
Continuing operations
Discontinued
operations
(Note 13(a))
Americas
Europe,
Middle East
and Africa
Asia Pacific
(excluding
Greater
China)
Greater
China
Corporate
or
unallocated Total
Greater
China
US$’000 US$’000 US$’000 US$’000 US$’000 US$’000 US$’000
Sales 4,506,451 3,606,048 2 ,113,250 6,125,75 4 –16,351,503 436,369
Segment operating results 88,915 122,549 (2,701) 426,248 (153,228) 481,783 (42,867)
Finance income 52,048 –
Finance costs (38,366) –
Impairment of assets (2,530) –
Gain on disposal of
available-for-sale financial
assets 19,791 –
Share of profits of associated
companies 124 –
Profit/(loss) before taxation 512,850 (42,867)
Taxation (47,613) 4,564
Profit/(loss) for the year 465,237 (38,303)
Capital expenditure 53,261 8,259 27,179 78,162 117,182 284,043 5,837
Other significant segment items included in the income statement are as follows:
Depreciation of property,
plant and equipment and
amortization of prepaid
lease payments 40,775 9,091 11,320 18,656 8,183 88,025 8,231
Amortization of intangible assets –––28,140 99,173 127,313 97
Employee benefit costs (Note 11) 380,105 314,907 191,310 250,901 56,973 1,194,196 62,396
Rental expenses under
operating leases 6,628 8,068 10,423 9,429 155 34,703 4,117
Restructuring costs (amount
net of reversal of unused
restructuring costs provision)
– Staff related costs (included
in employee benefit costs) 12,926 14,955 15,207 982 –44,070 8,352
– Others 3,558 (98) (119) 229 –3,570 –
Note:
Segment operating profit/(loss) presented above include the impact of restructuring costs of US$47,640,000. The segment operating profit/
(loss) before restructuring costs are: Americas US$105,399,000; Europe, Middle East and Africa US$137,406,000; Asia Pacific (excluding
Greater China) US$12,387,000; Greater China US$427,459,000; and corporate or unallocated (US$153,228,000) respectively.
Lenovo Group Limited • Annual Report 2007/08 99