Lenovo 2008 Annual Report Download - page 23
Download and view the complete annual report
Please find page 23 of the 2008 Lenovo annual report below. You can navigate through the pages in the report by either clicking on the pages listed below, or by using the keyword search tool below to find specific information within the annual report.-
 1
1 -
2
-
3
-
4
-
5
-
6
-
7
-
8
-
9
-
10
-
11
-
12
-
 13
13 -
 14
14 -
 15
15 -
 16
16 -
 17
17 -
 18
18 -
 19
19 -
 20
20 -
 21
21 -
 22
22 -
 23
23 -
 24
24 -
 25
25 -
 26
26 -
 27
27 -
 28
28 -
 29
29 -
 30
30 -
 31
31 -
 32
32 -
 33
33 -
34
-
35
-
36
-
37
-
38
-
39
-
40
-
41
-
42
-
43
-
44
-
45
-
46
-
47
-
48
-
49
-
50
-
51
-
52
-
53
-
54
-
55
-
56
-
57
-
58
-
59
-
60
-
61
-
62
-
63
-
64
-
65
-
66
-
67
-
68
-
69
-
70
-
71
-
72
-
73
-
74
-
75
-
76
-
77
-
78
-
79
-
80
-
81
-
82
-
83
-
84
-
85
-
86
-
87
-
88
-
89
-
90
-
91
-
92
-
93
-
94
-
95
-
96
-
97
-
98
-
99
-
100
-
101
-
102
-
103
-
104
-
105
-
106
-
107
-
108
-
109
-
110
-
111
-
112
-
113
-
114
-
115
-
116
-
117
-
118
-
119
-
120
-
121
-
122
-
123
-
124
-
125
-
126
-
127
-
128
-
129
-
130
-
131
-
132
-
133
-
134
-
135
-
136
-
137
-
138
-
139
-
140
-
141
-
142
-
143
-
144
-
145
-
146
-
147
-
148
 |
 |

21
Lenovo Group Limited • Annual Report 2007/08
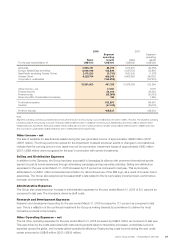
2008 2007
Segment Segment
operating operating
Sales results Sales results
For the year ended March 31 US$’000 US$’000 US$’000 US$’000
Americas 4,506,451 88,915 4,119,481 (27,538)
Europe, Middle East and Africa 3,606,048 122,549 3,056,723 25,856
Asia Pacific (excluding Greater China) 2,113,250 (2,701) 1,833,243 (1,278)
Greater China 6,125,754 426,248 4,968,862 294,150
Corporate or unallocated (153,228) (137,891)
16,351,503 481,783 13,978,309 153,299
Other income – net 17,261 8,187
Finance income 52,048 26,329
Finance costs (38,366) (35,133)
Share of profits of associated companies 124 1,869
Profit before taxation 512,850 154,551
Taxation (47,613) (26,197)
Profit for the year 465,237 128,354
Note:
Segment operating profit/(loss) presented above include the impact of restructuring costs of US$47,640,000 (2007: US$11,794,000). The segment operating
profit/(loss) before restructuring costs are: Americas US$105,399,000 (2007: (US$29,270,000)); Europe, Middle East and Africa US$137,406,000 (2007:
US$20,633,000); Asia Pacific (excluding Greater China) US$12,387,000 (2007: US$ 5,403,000); Greater China US$427,459,000 (2007: US$297,240,000);
and corporate or unallocated (US$153,228,000) (2007: (US$128,913,000)) respectively.
Other Income – net
The sale of available-for-sale financial assets during the year generated income of approximately US$20 million (2007:
US$17 million). The Group performs reviews for the impairment of assets whenever events or changes in circumstances
indicate that the carrying amount of an asset may not be recoverable. Impairment losses of approximately US$3 million
(2007: US$9 million) were recognized for the year in connection with certain investments.
Selling and Distribution Expenses
In addition to the Olympics, the Group has been successful in leveraging its alliance with prominent international sports
teams to boost its brand awareness through advertising campaigns and sponsorship activities. Selling and distribution
expenses for the year ended March 31, 2008 increased by 6.8 percent as compared to last year. This is principally
attributable to a US$31 million accelerated amortization for discontinued use of the IBM logo, as a result of broader brand
awareness. The Group also experienced increased staff costs related to the Group’s salary increment plan, performance
bonuses, and commissions.
Administrative Expenses
The Group also experienced an increase in administrative expenses for the year ended March 31, 2008 of 22.1 percent as
compared to last year. The increase is driven by staff costs.
Research and Development Expenses
Research and development spending for the year ended March 31, 2008 increased by 17.1 percent as compared to last
year. This is a reection of the continued investment the Group is making towards its commitment to deliver the most
innovative products in the industry.
Other Operating Expenses – net
The net other operating expenses for the year ended March 31, 2008 increased by US$23 million as compared to last year.
This was driven by the costs associated with restructuring actions taken to streamline processes, consolidate Lenovo’s
expertise across the globe, and increase global operational efficiency. Restructuring costs incurred during the year under
review amounted to US$48 million (2007: US$12 million).