Konica Minolta 2012 Annual Report Download - page 9
Download and view the complete annual report
Please find page 9 of the 2012 Konica Minolta annual report below. You can navigate through the pages in the report by either clicking on the pages listed below, or by using the keyword search tool below to find specific information within the annual report.-
 1
1 -
 2
2 -
 3
3 -
 4
4 -
 5
5 -
 6
6 -
 7
7 -
 8
8 -
 9
9 -
 10
10 -
 11
11 -
 12
12 -
 13
13 -
 14
14 -
 15
15 -
 16
16 -
 17
17 -
 18
18 -
 19
19 -
 20
20 -
21
-
22
-
23
-
24
-
25
-
26
-
27
-
28
-
29
-
30
-
31
-
32
-
33
-
34
-
35
-
36
-
37
-
38
-
39
-
40
-
41
-
42
-
43
-
44
-
45
-
46
-
47
-
48
 |
 |
Review of Operations
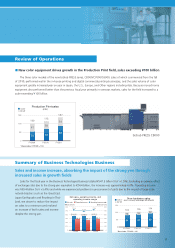
Sales and income increase, absorbing the impact of the strong yen through
increased sales in growth fi elds
Sales for the fi scal year in the Business Technologies Business totaled ¥547.5 billion (YoY +1.5%). Excluding an adverse effect
of exchange rates due to the strong yen equivalent to ¥24.4 billion, the increase was approximately 6.0%. Operating income
was ¥39.4 billion (YoY +5.4%) and while we experienced problems in procurement of parts due to the impact of large-scale
natural disasters such as the Great East
Japan Earthquake and fl ooding in Thai-
land, we strove to reduce the impact
on sales to a minimum and realized
an increase of both sales and income
despite the strong yen.
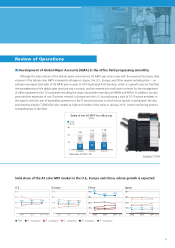
The three color models of the new bizhub PRESS series, C8000/C7000/C6000, sales of which commenced from the fall
of 2010, performed well in the in-house printing and digital commercial printing businesses, and the sales volume of color
equipment greatly increased year on year in Japan, the U.S., Europe, and Other regions including Asia. Because monochrome
equipment also performed better than the previous fi scal year primarily in overseas markets, sales for the fi eld increased to a
scale exceeding ¥100 billion.
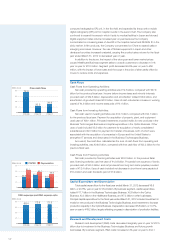
■ New color equipment drives growth in the Production Print field, sales exceeding ¥100 billion
Summary of Business Technologies Business
bizhub PRESS C8000
150
100 113
137
100
50
FY2009
53 63 82
47 50
54
FY2010 FY2011
0
Production Print sales
(units)
Color
B/W
* Base index: FY2009 = 100
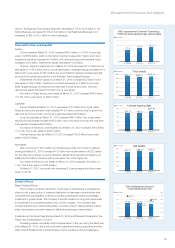
Net sales, operating income, and
operating income margin
Net sales
(Billions of yen) (Billions of yen)
Operating income Operating income margin
FY2009 FY2010 FY2011
540.8
7.2% 7.2%
6.9%
38.9 37.4 39.4
539.6 547.5
900
750
600
450
300
150
0
900
750
600
450
300
150
0
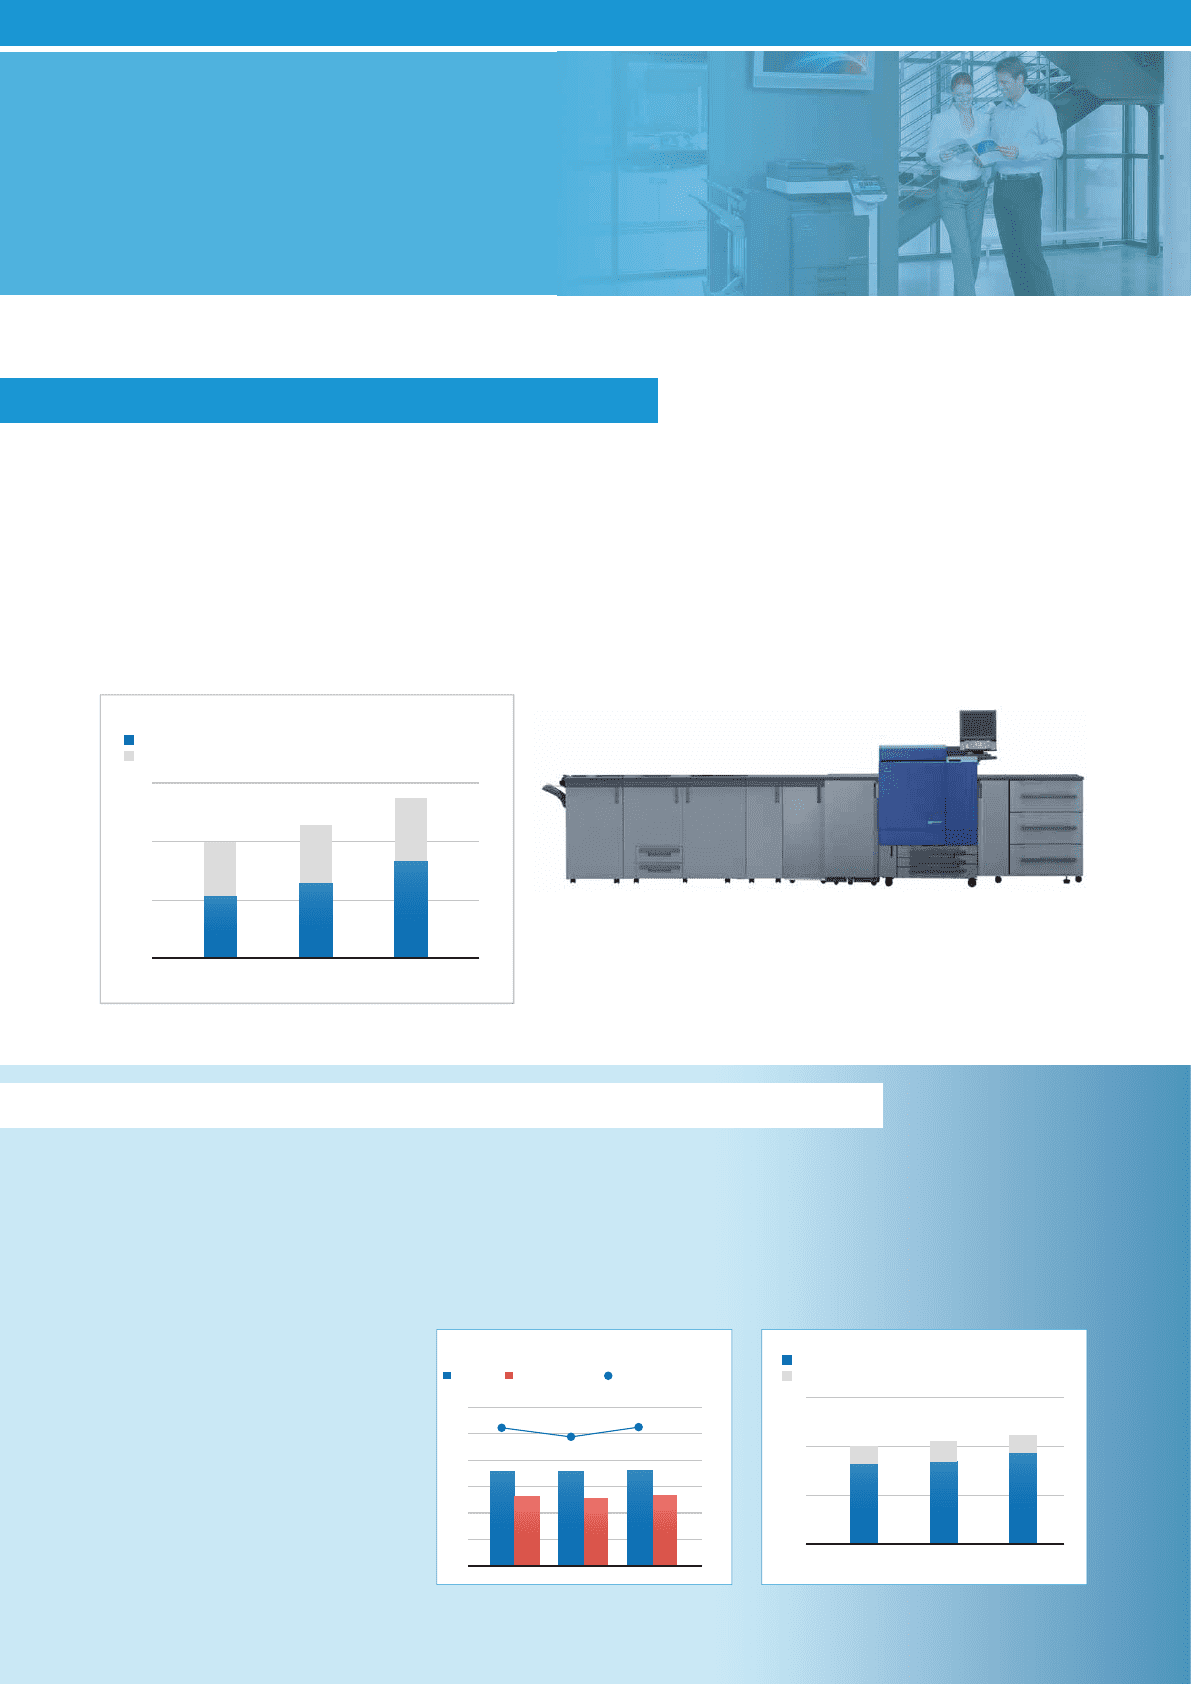
Non-hardware sales
(excl. currency exchange rate effects)
84 87 92
16
100 105 114
18 22
FY2009 FY2010 FY2011
150
100
50
0
Color
B/W
* Base index: FY2009 = 100
8