Konica Minolta 2012 Annual Report Download - page 7
Download and view the complete annual report
Please find page 7 of the 2012 Konica Minolta annual report below. You can navigate through the pages in the report by either clicking on the pages listed below, or by using the keyword search tool below to find specific information within the annual report.
Review of Operations
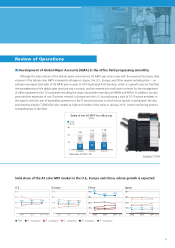
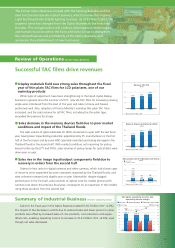
Although the sales volume of the bizhub series monochrome A3 MFPs was only on par with the previous fi scal year, sales
volumes of the bizhub color MFPs increased in all regions―Japan, the U.S., Europe, and Other regions including Asia―, re-
sulting in increased total sales of A3 MFPs year on year. In OPS (Optimized Print Services), which is a growth area for the fi eld,
the strengthening of the global sales structure was a success, and we entered into multi-year contracts for the management
of offi ce equipment with 15 companies including the major automobile manufacturer BMW and NASA. In addition, we also
promoted the expansion of our IT services network in Europe and the U.S. by purchasing a total of 10 IT service providers in
the regions, with the aim of expanding operations to the IT services business in which future growth is anticipated. We also
launched the bizhub C754/C654 color models as high-end models of the series in January 2012, further reinforcing product
competitiveness in the fi eld.
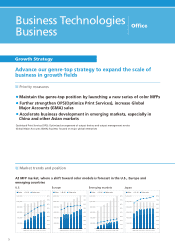
Solid share of the A3 color MFP market in the U.S., Europe and China, where growth is expected
■ Development of Global Major Accounts (GMA) in the office field progressing smoothly
U.S. Europe China Japan
bizhub C754
(CY)
40%
30%
20%
10%
0% 2009 2010 2011
19%
19%
1
20%
19% 19%
20%
(CY)
40%
30%
20%
10%
0% 2009 2010 2011
18%
%
8%
%
8
1
9%
9
1
1
9%
9
19%
18% 18% 19%
40%
30%
20%
10%
0% 2009 2010 2011 (CY)
40%
30%
20%
10%
0% 2009 2010 2011
38%
32% 33%
40%
30%
20%
10%
0% 2009 2010 2011 (CY)
40%
30%
20%
10%
0% 2009 2010 2011
%
%
7%
7%
7
7
%
%
%
7%
7%
7
7
%
%
%
7%
7%
7
7
%
7% 7% 7%
Color
Sales of the A3 MFP for ofce use
(units)
B/W
150
100 114 118
62 61 69
100
50
FY2009
38 53 49
* Base index: FY2009 = 100
FY2010 FY2011
0
KM A company B company C company D company E company
6

