Konica Minolta 2012 Annual Report Download - page 20
Download and view the complete annual report
Please find page 20 of the 2012 Konica Minolta annual report below. You can navigate through the pages in the report by either clicking on the pages listed below, or by using the keyword search tool below to find specific information within the annual report.-
 1
1 -
2
-
3
-
4
-
5
-
6
-
7
-
8
-
9
-
 10
10 -
 11
11 -
 12
12 -
 13
13 -
 14
14 -
 15
15 -
 16
16 -
 17
17 -
 18
18 -
 19
19 -
 20
20 -
 21
21 -
 22
22 -
 23
23 -
 24
24 -
 25
25 -
 26
26 -
 27
27 -
 28
28 -
 29
29 -
 30
30 -
31
-
32
-
33
-
34
-
35
-
36
-
37
-
38
-
39
-
40
-
41
-
42
-
43
-
44
-
45
-
46
-
47
-
48
 |
 |

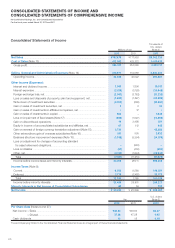
conditions for sales. However, increased sales of profi table core
products and thorough cost controls enabled the Group to
generally achieve its earnings targets from operating income to
net income. Based on these circumstances, the Company
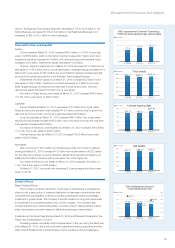
declared a year-end cash dividend of ¥7.50 per share. In
conjunction with the interim cash dividend, cash dividends per
share for the year ended March 31, 2012 totaled ¥15.00.
While the operating environment remains uncertain, for the
fi scal year ending March 31, 2013, the Company assumes it
will achieve its performance targets and therefore plans to pay
an interim and a year-end cash dividend per share of ¥7.50
each for total annual dividends of ¥15.00 per share.
Outlook for the Fiscal Year Ending March 31, 2013
Looking at the global economic conditions surrounding the
Group, the outlook for the European economy remains
uncertain due to its fi scal problems. We expect that the United
States will grow moderately overall but will continue to expand
and contract. Growth in emerging economies, especially China,
India, and other Asian economies, is expected to slow, but we
expect these economies to maintain higher economic growth
rates than those of developed economies. The Japanese
economy is expected to recover, backed by demand
associated with post-earthquake reconstruction.
In the Business Technologies Business, we expect that
demand for production printing products will continue to
expand both in Japan and in overseas markets. We also
forecast that growth in emerging markets will drive demand for
offi ce MFPs. In developed countries, we expect to boost
demand from global major accounts by leveraging the
development of OPS. In the Industrial Business*, prolonged
adjustments of digital consumer electronics inventory, including
LCD TVs, are expected to come to an end, bringing an overall
recovery in demand. In the Healthcare Business, we anticipate
that demand for cassette DR and compact CR will continue to
expand, especially in the hospital and clinic markets.
*
The reportable segments in the fi scal year ended March 31, 2012 were the
Business Technologies Business, the Optics Business, and the Healthcare
Business. However, with the reorganization of the Group in April 2012, the
reportable segments will be the Business Technologies Business, Industrial
Business, and Healthcare Business from the fi scal year ending March 31, 2013.
Considering the above circumstances, we have made the
following forecasts for the fi scal year ending March 31, 2013.
We assume exchange rates of JPY 80 to USD 1 and JPY
100 to EUR 1.
Konica Minolta Group Risks
The following risks could have a signifi cant effect on the
judgment of investors in the Group. Further, the forward-looking
statements in the following section are the Group’s judgments
as of June 21, 2012.
Economic Risks
(1) Economic Trends in Primary Markets
The Group provides MFPs, production printing
equipment, image input/output components, display
materials, products and equipment for use in healthcare, and
related services to customers worldwide. Economic
conditions in national markets signifi cantly affect sales and
earnings in these businesses.
Risks of concern in the global economy include the
protracted debt problems in Europe, high crude oil prices due
to political instability in oil-producing countries, and economic
policy revisions in leading countries due to major elections.
Japan’s economy is expected to recover moderately because
of the impact of reconstruction and restoration demand
following the Great East Japan Earthquake and the fl ooding in
Thailand, but conditions remain unclear. Recessions in
national markets that cause customers to restrain investment,
reduce operating expenses or reduce consumption could
adversely affect the Group’s results or fi nances in ways such
as causing inventories to increase, reducing sales prices by
increasing competition, or reducing sales volume.
(2) Changes in Exchange Rates
Overseas sales account for 72.0% of the Group’s net
sales. The Group operates globally and is signifi cantly affected
by exchange rate fl uctuations.
The Group ameliorates the impact of exchange rates by
conducting hedging transactions centered on futures
contracts for major currencies including the U.S. dollar and
the euro. In addition, the impact of USD-denominated
procurement for the MFPs and printers the Business
Technologies Business produces in China is light because it is
basically offset by sales and payables in regions where sales
are denominated in U.S. dollars. However, fl uctuations in euro
exchange rates directly impact earnings. Generally, yen
appreciation versus the U.S. dollar and euro negatively affects
results, while yen depreciation versus these currencies
positively affects results.
The Group takes steps to ameliorate the impact of
currency exchange rate fl uctuations because yen appreciation
negatively affects its results. However, continued yen
appreciation could negatively affect the Group’s results.
Industry and Business Activity Risks
(3) Competition in Technology Innovation
The ability to innovate faster than other companies is the
primary source of competitive advantage in the Group’s core
businesses including MFPs, production printing equipment
and other information equipment, TAC polarizing fi lm for
LCDs, and pickup lenses for optical disks, and in the Group’s
key areas for future development including organic
electroluminescent (EL) lighting.
Performance Forecast for the Fiscal Year Ending
March 31, 2013 (As of July 27, 2012)
(Billions of
yen)
Net sales 800.0
Operating income 48.0
Operating income ratio 6.0%
Amortization of goodwill 8.8
Operating income before amortization of goodwill 56.8
Operating income ratio before amortization of goodwill 7.1%
Net income 22.0
Capital expenditure 50.0
Depreciation 55.0
Research and development costs 73.0
Free cash flow (10.0)
CF from operating activities - CF from investing activities 30.0
19