Konica Minolta 2012 Annual Report Download - page 46
Download and view the complete annual report
Please find page 46 of the 2012 Konica Minolta annual report below. You can navigate through the pages in the report by either clicking on the pages listed below, or by using the keyword search tool below to find specific information within the annual report.-
 1
1 -
2
-
3
-
4
-
5
-
6
-
7
-
8
-
9
-
10
-
11
-
12
-
13
-
14
-
15
-
16
-
17
-
18
-
19
-
20
-
21
-
22
-
23
-
24
-
25
-
26
-
27
-
28
-
29
-
30
-
31
-
32
-
33
-
34
-
35
-
 36
36 -
 37
37 -
 38
38 -
 39
39 -
 40
40 -
 41
41 -
 42
42 -
 43
43 -
 44
44 -
 45
45 -
 46
46 -
 47
47 -
 48
48
 |
 |

45
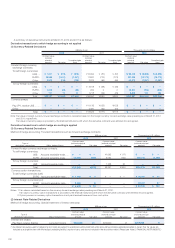
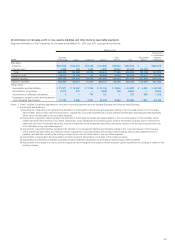
Information on Amortization of Goodwill and Balance of Goodwill by Reportable Segments
Information on amortization of goodwill and balance of goodwill for the years ended March 31, 2012 and 2011 is presented as follows:
Millions of yen
2012
Business
Technologies Optics Healthcare Subtotal Other
Eliminations and
Corporate Total
Amortization of goodwill .......... ¥ 8,312 ¥ 347 ¥— ¥ 8,659 ¥ 145 ¥— ¥ 8,804
Balance of goodwill ................ 54,694 3,355 — 58,050 1,677 — 59,727
Note: ‘Other’ consists of business segments not included in reporting segments such as Sensing Business.
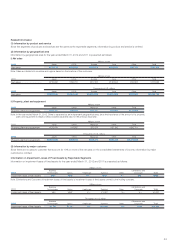
Millions of yen
2011
Business
Technologies Optics Healthcare Subtotal Other
Eliminations and
Corporate Total
Amortization of goodwill .......... ¥ 7,854 ¥ 402 ¥— ¥ 8,256 ¥ 145 ¥— ¥ 8,401
Balance of goodwill ................ 57,621 3,702 — 61,323 1,822 — 63,146
Thousands of U.S. dollars
2012
Business
Technologies Optics Healthcare Subtotal Other
Eliminations and
Corporate Total
Amortization of goodwill .......... $101,132 $ 4,222 $— $105,353 $ 1,764 $— $107,118
Balance of goodwill ................ 665,458 40,820 — 706,290 20,404 — 726,694
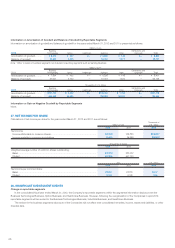
Information on Gain on Negative Goodwill by Reportable Segments
None.
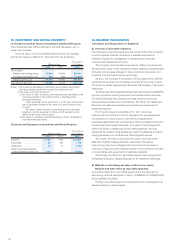
27. NET INCOME PER SHARE
Calculations of net income per share for the years ended March 31, 2012 and 2011 are as follows:
Millions of yen
Thousands of
U.S. dollars
2012 2011 2012
Net income:
Income attributable to common shares ............................................................... ¥20,424 ¥25,896 $248,497
Income available to common stockholders .......................................................... 20,424 25,896 248,497
Thousands of shares
2012 2011
Weighted average number of common shares outstanding:
Basic ............................................................................................................ 530,254 530,222
Diluted .......................................................................................................... 547,896 547,723
Yen U.S. dollars
2012 2011 2012
Net income per common share:
Basic ............................................................................................................ ¥38.52 ¥48.84 $0.47
Diluted .......................................................................................................... 37.28 47.28 0.45
28. SIGNIFICANT SUBSEQUENT EVENTS
Change in reportable segments
In the consolidated fi scal year ended March 31, 2012, the Company’s reportable segments within the segmental information disclosure are the
Business Technologies Business, Optics Business, and Healthcare Business. However, following the reorganization of the Companies in April 2012,
reportable segments will be revised to the Business Technologies Business, Industrial Business, and Healthcare Business.
The revision in the business segments disclosure of the Companies will not affect total consolidated net sales, income, assets and liabilities, or other
fi nancial data.