Konica Minolta 2012 Annual Report Download - page 26
Download and view the complete annual report
Please find page 26 of the 2012 Konica Minolta annual report below. You can navigate through the pages in the report by either clicking on the pages listed below, or by using the keyword search tool below to find specific information within the annual report.-
 1
1 -
2
-
3
-
4
-
5
-
6
-
7
-
8
-
9
-
10
-
11
-
12
-
13
-
14
-
15
-
 16
16 -
 17
17 -
 18
18 -
 19
19 -
 20
20 -
 21
21 -
 22
22 -
 23
23 -
 24
24 -
 25
25 -
 26
26 -
 27
27 -
 28
28 -
 29
29 -
 30
30 -
 31
31 -
 32
32 -
 33
33 -
 34
34 -
 35
35 -
 36
36 -
37
-
38
-
39
-
40
-
41
-
42
-
43
-
44
-
45
-
46
-
47
-
48
 |
 |

25
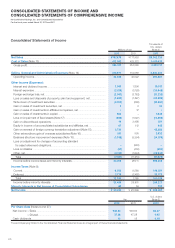
CONSOLIDATED STATEMENTS OF INCOME AND
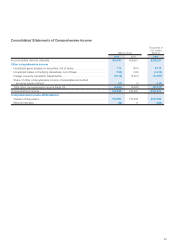
CONSOLIDATED STATEMENTS OF COMPREHENSIVE INCOME
Konica Minolta Holdings, Inc. and Consolidated Subsidiaries
For the scal years ended March 31, 2012 and 2011
Consolidated Statements of Income
Millions of yen
Thousands of
U.S. dollars
(Note 3)
2012 2011 2012
Net Sales .................................................................................................................. ¥767,879 ¥777,953 $9,342,730
Cost of Sales (Note 13) ............................................................................................ 412,562 423,372 5,019,613
Gross profi t ............................................................................................................. 355,317 354,580 4,323,117
Selling, General and Administrative Expenses (Note 14) ..................................... 314,971 314,558 3,832,230
Operating income ................................................................................................... 40,346 40,022 490,887
Other Income (Expenses):
Interest and dividend income ................................................................................. 1,563 1,806 19,017
Interest expenses ................................................................................................... (2,519) (3,129) (30,648)
Foreign exchange loss, net ..................................................................................... (2,567) (3,762) (31,233)
Loss on sales and disposals of property, plant and equipment, net ...................... (1,693) (1,527) (20,599)
Write-down of investment securities ....................................................................... (2,700) (680) (32,851)
Gain on sales of investment securities, net ............................................................ 2 3 24
Gain on sales of investments in affi liated companies, net ...................................... –12 –
Gain on sales of investments in capital ................................................................... 604 –7,3 49
Loss on impairment of fi xed assets (Note 17) ......................................................... (893) (1,027) (10,865)
Gain on discontinued operations ........................................................................... 19 2,498 231
Equity in income of unconsolidated subsidiaries and affi liates, net ........................ 67 112 815
Gain on reversal of foreign currency translation adjustment (Note 15) .................... 3,730 –45,383
Other extraordinary gain of overseas subsidiaries (Note 16) .................................. 241 505 2,932
Business structure improvement expenses (Note 18) ............................................ (1,198) (3,394) (14,576)
Loss on adjustment for changes of accounting standard
for asset retirement obligations............................................................................ –(983) –
Loss on disaster .................................................................................................... (57) (450) (694)
Other, net ................................................................................................................ (2,132) (1,894) (25,940)
Total ..................................................................................................................... (7,531) (11,910) (91,629)
Income before income taxes and minority interests ............................................... 32,815 28,111 399,258
Income Taxes (Note 8):
Current.................................................................................................................... 9,553 9,580 116,231
Deferred .................................................................................................................. 2,776 (7,420) 33,775
Total ..................................................................................................................... 12,330 2,160 150,018
Income before minority interests ............................................................................ 20,484 25,951 249,227
Minority Interests in Net Income of Consolidated Subsidiaries ......................... 60 54 730
Net Income ............................................................................................................... ¥ 20,424 ¥ 25,896 $ 248,497
Yen
U.S. dollars
(Note 3)
2012 2011 2012
Per Share Data (Notes 9 and 27):
Net income —Basic ................................................................................................ ¥38.52 ¥48.84 $0.47
—Diluted .............................................................................................. 37.28 47.28 0.45
Cash dividends ....................................................................................................... 15 15 0.18
The accompanying Notes to the Consolidated Financial Statements are an integral part of these fi nancial statements.