Konica Minolta 2012 Annual Report Download - page 13
Download and view the complete annual report
Please find page 13 of the 2012 Konica Minolta annual report below. You can navigate through the pages in the report by either clicking on the pages listed below, or by using the keyword search tool below to find specific information within the annual report.-
 1
1 -
2
-
 3
3 -
 4
4 -
 5
5 -
 6
6 -
 7
7 -
 8
8 -
 9
9 -
 10
10 -
 11
11 -
 12
12 -
 13
13 -
 14
14 -
 15
15 -
 16
16 -
 17
17 -
 18
18 -
 19
19 -
 20
20 -
 21
21 -
 22
22 -
 23
23 -
24
-
25
-
26
-
27
-
28
-
29
-
30
-
31
-
32
-
33
-
34
-
35
-
36
-
37
-
38
-
39
-
40
-
41
-
42
-
43
-
44
-
45
-
46
-
47
-
48
 |
 |

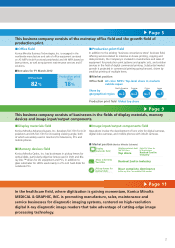
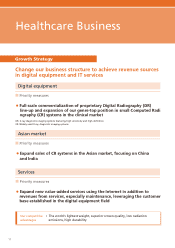
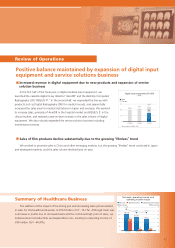
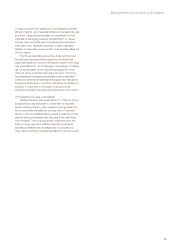
Review of Operations
Positive balance maintained by expansion of digital input
equipment and service solutions business
■ Increased revenue in digital equipment due to new products and expansion of service
solution business
■ Sales of film products decline substantially due to the growing filmless trend
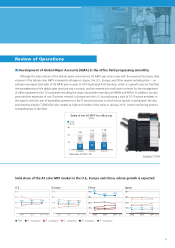
In the fi rst half of the fi scal year, in digital medical input equipment, we
launched the cassette digital X-ray detector AeroDR and the desktop Computed
Radiography (CR) REGIUS Σ. In the second half, we expanded the line-up with
products such as Digital Radiography (DR) for medical rounds, and sequentially
increased the sales area for medical institutions in Japan and overseas. We worked
to increase sales, primarily of AeroDR in the hospital market and REGIUS Σ in the
clinical market, and realized a year-on-year increase in the sales volume of digital
equipment. We also robustly expanded the service solution business including
maintenance services.
We worked to promote sales in China and other emerging markets, but the growing fi lmless trend continued in Japan
and developed markets, and the sales volume declined year on year.
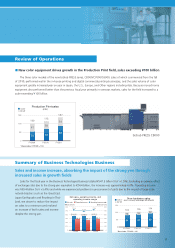
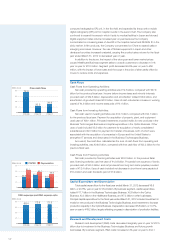
Summary of Healthcare Business
The addition of the impact of the strong yen and decreasing sales prices resulted
in sales for the Healthcare Business of ¥73.0 billion (YoY -14.1%). Although there was
a decrease in profi ts due to decreased sales and the continued high price of silver, we
implemented cost reductions and expenditure cuts, resulting in operating income of
¥90 million (YoY -46.9%).
1.4%
0.2% 0.1%
Net sales, operating income, and
operating income margin
Net sales
(Billions of yen) (Billions of yen)
Operating income Operating income margin
FY2009 FY2010 FY2011
150
125
100
75
50
25
0
3.0
2.5
2.0
1.5
1.0
0.5
0
104.0
84.9 73.0
0.09
0.1
1.4
100 111
127
67
60
Digital input equipment (CR / DR)
(units)
150
100
50
0
FY2009 FY2010 FY2011
* Base index: FY2009 = 100
New
Current
12