Konica Minolta 2012 Annual Report Download - page 18
Download and view the complete annual report
Please find page 18 of the 2012 Konica Minolta annual report below. You can navigate through the pages in the report by either clicking on the pages listed below, or by using the keyword search tool below to find specific information within the annual report.-
 1
1 -
2
-
3
-
4
-
5
-
6
-
7
-
 8
8 -
 9
9 -
 10
10 -
 11
11 -
 12
12 -
 13
13 -
 14
14 -
 15
15 -
 16
16 -
 17
17 -
 18
18 -
 19
19 -
 20
20 -
 21
21 -
 22
22 -
 23
23 -
 24
24 -
 25
25 -
 26
26 -
 27
27 -
 28
28 -
29
-
30
-
31
-
32
-
33
-
34
-
35
-
36
-
37
-
38
-
39
-
40
-
41
-
42
-
43
-
44
-
45
-
46
-
47
-
48
 |
 |

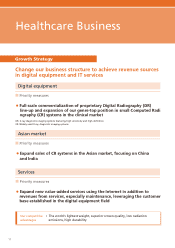
computed radiography (CR) unit, in the fi rst half, and expanded its lineup with a mobile
digital radiography (DR) unit for hospital rounds in the second half. The Company also
continued to expand the areas in which it sells to medical facilities in Japan and abroad.
Digital equipment sales volume increased year on year because the Company
concentrated on increasing sales of AeroDR in the hospital market and REGIUS Σ in the
clinic market. In fi lm products, the Company concentrated on China to expand sales in
emerging economies. However, the use of fi lmless equipment in Japan and other
developed countries increased unabated, causing fi lm product sales volume for the fi scal
year ended March 31, 2012 to decreased year on year.
In addition to the above, the impact of the strong yen and lower market prices
caused Healthcare Business segment sales to outside customers to decrease 14.1%
year on year to ¥73.0 billion. Segment profi t decreased 46.9% year on year to ¥90
million, with the impact of lower sales and the surge in the price of silver partly offset by
moves to reduce costs and expenses.
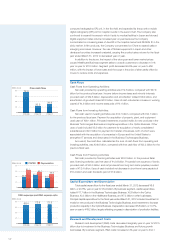
Cash Flows
Cash Flows from Operating Activities:
Net cash provided by operating activities was ¥72.3 billion, compared with ¥67.9
billion for the previous fi scal year. Income before income taxes and minority interests
provided cash of ¥32.8 billion. Depreciation and amortization totaled ¥49.2 billion, and
amortization of goodwill totaled ¥8.8 billion. Uses of cash included an increase in working
capital of ¥4.9 billion and income taxes paid of ¥6.1 billion.
Cash Flows from Investing Activities:
Net cash used in investing activities was ¥42.7 billion, compared with ¥44.7 billion
for the previous fi scal year. Payment for acquisition of property, plant, and equipment
used cash of ¥29.1 billion. Principal investments included molds for new products in the
Business Technologies Business and capital expenditure in the Optics Business. Other
uses of cash included ¥5.5 billion for payment for acquisition of newly consolidated
subsidiaries and ¥2.3 billion for payment for transfer of business, both of which were
associated with the acquisition of companies in Europe and the United States to
strengthen IT services and direct sales in the Business Technologies Business.
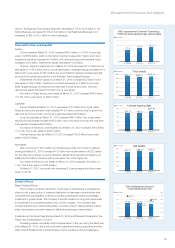
As a result, free cash fl ow, calculated as the sum of cash fl ows from operating and
investing activities, was ¥29.6 billion, compared with free cash fl ow of ¥23.2 billion for the
previous fi scal year.
Cash Flows from Financing Activities:
Net cash provided by fi nancing activities was ¥26.3 billion. In the previous fi scal
year, fi nancing activities used net cash of ¥12.9 billion. Proceeds from issuance of bonds
provided cash of ¥40.0 billion, and net proceeds from long-term loans payable provided
cash of ¥12.4 billion. Uses of cash included net decrease in short-term loans payable of
¥16.4 billion and cash dividends paid of ¥7.9 billion.
Capital Expenditure and Depreciation
Total capital expenditure for the fi scal year ended March 31, 2012 decreased ¥8.9
billion, or 20.8%, year on year to ¥34.0 billion. By business segment, capital expenditure
totaled ¥17.7 billion in the Business Technologies Business, ¥6.6 billion in the Optics
Business, ¥2.3 billion in the Healthcare Business, and ¥7.2 billion in other businesses.
Principal capital expenditure for the fi scal year ended March 31, 2012 included investment in
molds for new products in the Business Technologies Business, and investment to increase
production capacity in the Optics Business. Depreciation decreased ¥5.8 billion, or 10.7%,
year on year to ¥49.2 billion, largely refl ecting progress in depreciation of production facilities.
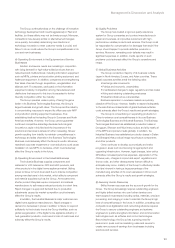
Research and Development Costs
Research and development (R&D) costs decreased marginally year on year to ¥72.5
billion due to investment in the Business Technologies Business and future growth
businesses. By business segment, R&D costs increased 2.4% year on year to ¥44.1
Free cash ow
80 72.9
23.2 29.6
60
40
20
FY2009 FY2010 FY2011
0
(Billions of yen)
FY2009 FY2010 FY2011
36.9
61.1
42.9
34.0
49.2
55.1
(Billions of yen)
80
60
40
20
0
CAPEX Depreciation
R&D expenses and R&D expense ratio
80 68.4 72.6 72.5
60
40
20
FY2009 FY2010 FY2011
0
(Billions of yen)
17