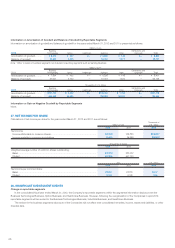
Konica Minolta 2012 Annual Report Download - page 44
Download and view the complete annual report
Please find page 44 of the 2012 Konica Minolta annual report below. You can navigate through the pages in the report by either clicking on the pages listed below, or by using the keyword search tool below to find specific information within the annual report.
43
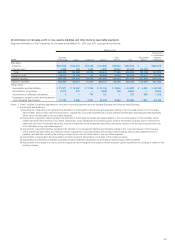
Millions of yen
2011
Business
Technologies Optics
Healthcare
(Note 2) Subtotal
Other
(Note 1) Total Adjustments
Total amounts
in consolidated
fi n a n c i a l
statements
Net sales
External .............................................. ¥539,639 ¥129,836 ¥84,990 ¥754,465 ¥23,487 ¥777,953 ¥ — ¥777,953
Intersegment ....................................... 3,067 799 1,598 5,466 50,451 55,917 (55,917) —
Total ................................................. 542,706 130,636 86,589 759,932 73,939 833,871 (55,917) 777,953
Segment profi t ....................................... 37,457 12,813 171 50,442 5,455 55,898 (15,876) 40,022
Segment assets ..................................... 390,299 130,592 61,032 581,924 54,869 636,794 208,659 845,453
Segment liabilities .................................. 196,669 81,952 39,054 317,676 74,413 392,089 24,375 416,465
Other items
Depreciation and amortization ................... ¥ 24,337 ¥ 21,093 ¥ 3,185 ¥ 48,615 ¥ 2,222 ¥ 50,837 ¥ 4,291 ¥ 55,129
Amortization of goodwill ........................ 7,854 402 — 8,256 145 8,401 — 8,401
Investments in affi liated companies ......... 3 — 732 735 — 735 928 1,664
Increases in property, plant and
equipment and intangible fi xed assets .... 12,960 19,624 3,002 35,587 1,695 37,283 5,699 42,982
Notes: 1. ‘Other’ consists of business segments not included in reporting segments such as Sensing Business and Industrial Inkjet Business.
2. In the year ended March 31, 2011, the segment title of the Medical & Graphic Imaging Business, which was utilized until the fi rst half of the fi scal year, was
changed to the Healthcare Business from to the third quarter. The results of the Healthcare Business for the fi scal year include those of the Medical &
Graphic Imaging Business for the fi rst half.
3. Information calculated based on segment information for the year ended March 31, 2012.
Obtaining the necessary comparative information to prepare segment information for the previous fi scal year or for the year ended March 31, 2012 in
accordance with the effective segment guidance/standard for the year ended March 31, 2012 has proved to be diffi cult. Doing so will impose an
excessive burden on the Company. Furthermore, no such segment information has been reported to management. Considering those reasons and the
utilization of such segment information, we have not disclosed such information except for in regards to external net sales.
If segment information was prepared for the previous fi scal year based on segment information for the year ended March 31, 2012, net sales in the
Business Technologies Business and the Healthcare Business are ¥544,506 million and ¥80,122 million, respectively. Net sales in the Business Technologies
Business include ¥4,867 million of the former Graphic Imaging Business.
Thousands of U.S. dollars
2012
Business
Technologies Optics Healthcare Subtotal Other Total Adjustments
Total amounts
in consolidated
fi n a n c i a l
statements
Net sales
External .............................................. $6,662,319 $1,512,508 $888,746 $9,063,584 $279,146 $9,342,730 $ — $ 9,342,730
Intersegment ....................................... 22,545 9,186 23,482 55,226 586,519 641,745 (641,745) —
Total ................................................. 6,684,877 1,521,694 912,228 9,118,810 865,665 9,984,487 (641,745) 9,342,730
Segment profi t ....................................... 480,338 170,799 1,107 652,245 67,575 719,832 (228,945) 490,887
Segment assets ..................................... 4,863,779 1,446,210 790,850 7,100,864 688,563 7,789,427 3,185,777 10,975,204
Segment liabilities .................................. 2,376,250 807,896 499,087 3,683,258 313,031 3,996,289 1,686,446 5,682,735
Other items
Depreciation and amortization ................... $ 260,092 $ 202,665 $ 37,778 $ 500,548 $ 46,794 $ 547,354 $ 51,734 $ 599,087
Amortization of goodwill ........................ 101,132 4,222 — 105,353 1,764 107,118 — 107,118
Investments in affi liated companies ......... 37 — 8,931 8,967 — 8,967 11,984 20,951
Increases in property, plant and
equipment and intangible fi xed assets .... 216,340 80,375 28,604 325,332 72,345 397,676 16,389 414,077


