Konica Minolta 2012 Annual Report Download - page 29
Download and view the complete annual report
Please find page 29 of the 2012 Konica Minolta annual report below. You can navigate through the pages in the report by either clicking on the pages listed below, or by using the keyword search tool below to find specific information within the annual report.-
 1
1 -
2
-
3
-
4
-
5
-
6
-
7
-
8
-
9
-
10
-
11
-
12
-
13
-
14
-
15
-
16
-
17
-
18
-
 19
19 -
 20
20 -
 21
21 -
 22
22 -
 23
23 -
 24
24 -
 25
25 -
 26
26 -
 27
27 -
 28
28 -
 29
29 -
 30
30 -
 31
31 -
 32
32 -
 33
33 -
 34
34 -
 35
35 -
 36
36 -
 37
37 -
 38
38 -
 39
39 -
40
-
41
-
42
-
43
-
44
-
45
-
46
-
47
-
48
 |
 |
28
Millions of yen
Thousands of
U.S. dollars
(Note 3)
2012 2011 2012
Cash Flows from Operating Activities:
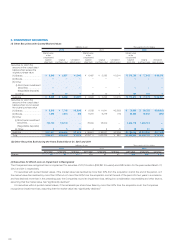
Income before income taxes and minority interests ......................................................... ¥ 32,815 ¥ 28,111 $ 399,258
Depreciation and amortization ...................................................................................... 49,239 55,129 599,087
Loss on impairment of fi xed assets ............................................................................... 893 1,027 10,865
Amortization of goodwill ............................................................................................... 8,804 8,401 107,118
Interest and dividend income ........................................................................................ (1,563) (1,807) (19,017)
Interest expense ......................................................................................................... 2,519 3,129 30,648
Loss on sales and disposals of property, plant and equipment ......................................... 1,693 1,526 20,599
Loss on sales and write-down of investment securities .................................................... 2,698 678 32,826
Gain on sales of investments in capital ........................................................................... (604) — (7,349)
Gain on reversal of foreign currency translation adjustment .............................................. (3,730) — (45,383)
Decrease in provision for bonuses ................................................................................ (85) (203) (1,034)
Increase (Decrease) in accrued retirement benefi ts.......................................................... 359 (8,358) 4,368
Decrease in reserve for discontinued operations ............................................................. (26) (4,688) (316)
Decrease (Increase) in trade notes and accounts receivable ............................................. (13,442) 3,411 (163,548)
Increase in inventories ................................................................................................. (6,268) (7,800) (76,262)
Increase in trade notes and accounts payable ................................................................ 14,715 433 179,036
Transfer of rental business-use assets ........................................................................... (4,700) (5,324) (57,185)
Increase in accounts receivable–other ........................................................................... (4,449) (543) (54,131)
Increase in accounts payable–other and accrued expenses ............................................. 866 2,402 10,537
Decrease/increase in consumption taxes receivable/payable ........................................... 1,249 (479) 15,196
Other ......................................................................................................................... (1,543) 3,603 (18,774)
Subtotal ................................................................................................................... 79,439 78,650 966,529
Interest and dividend income received ........................................................................... 1,534 1,808 18,664
Interest paid ............................................................................................................... (2,414) (3,098) (29,371)
Income taxes paid ....................................................................................................... (6,192) (9,402) (75,338)
Net cash provided by operating activities ....................................................................... 72,367 67,957 880,484
Cash Flows from Investing Activities:
Payment for acquisition of property, plant and equipment ................................................ (29,104) (37,026) (354,106)
Proceeds from sales of property, plant and equipment .................................................... 504 1,155 6,132
Payment for acquisition of intangible fi xed assets ............................................................ (5,862) (5,808) (71,323)
Proceeds from transfer of business ............................................................................... — 577 —
Payment for transfer of business ................................................................................... (2,393) — (29,115)
Payment for acquisition of newly consolidated subsidiaries .............................................. (5,506) (2,508) (66,991)
Payment for loans receivable ........................................................................................ (248) (475) (3,017)
Proceeds from collection of loans receivable .................................................................. 138 240 1,679
Payment for acquisition of investment securities ............................................................. (6) (96) (73)
Proceeds from sales of investment securities ................................................................. 2 29 24
Proceeds from sales of investments in capital ................................................................. 1,315 — 16,000
Payment for acquisition of other investments .................................................................. (1,773) (1,271) (21,572)
Other ......................................................................................................................... 177 445 2,154
Net cash used in investing activities ............................................................................. (42,757) (44,738) (520,221)
Cash Flows from Financing Activities:
Decrease in short-term loans payable ............................................................................ (16,439) (6,551) (200,012)
Proceeds from long-term loans payable ......................................................................... 38,304 989 466,042
Repayment of long-term loans payable .......................................................................... (25,805) (27,565) (313,968)
Proceeds from issuance of bonds ................................................................................. 40,000 30,000 486,677
Repayments of lease obligations ................................................................................... (1,715) (1,838) (20,866)
Proceeds from disposal of treasury stock ...................................................................... 3 4 37
Payment for purchase of treasury stock ......................................................................... (11) (76) (134)
Dividend payments ..................................................................................................... (7,945) (7,942) (96,666)
Dividend proceeds from minority shareholders in consolidated subsidiaries ....................... — 51 —
Net cash provided by (used in) fi nancing activities ......................................................... 26,390 (12,928) 321,085
Effect of Exchange Rate Changes on Cash and Cash Equivalents ................................... 785 711 9,551
Increase in Cash and Cash Equivalents ......................................................................... 56,785 11,002 690,899
Cash and Cash Equivalents at the Beginning of the Year (Note 4) ..................................... 175,148 164,146 2,131,014
Cash and Cash Equivalents at the End of the Year (Note 4) .............................................. ¥231,933 ¥175,148 $2,821,913
The accompanying Notes to the Consolidated Financial Statements are an integral part of these fi nancial statements.
CONSOLIDATED STATEMENTS OF CASH FLOWS
Konica Minolta Holdings, Inc. and Consolidated Subsidiaries
For the scal years ended March 31, 2012 and 2011