Konica Minolta 2012 Annual Report Download - page 19
Download and view the complete annual report
Please find page 19 of the 2012 Konica Minolta annual report below. You can navigate through the pages in the report by either clicking on the pages listed below, or by using the keyword search tool below to find specific information within the annual report.-
 1
1 -
2
-
3
-
4
-
5
-
6
-
7
-
8
-
 9
9 -
 10
10 -
 11
11 -
 12
12 -
 13
13 -
 14
14 -
 15
15 -
 16
16 -
 17
17 -
 18
18 -
 19
19 -
 20
20 -
 21
21 -
 22
22 -
 23
23 -
 24
24 -
 25
25 -
 26
26 -
 27
27 -
 28
28 -
 29
29 -
30
-
31
-
32
-
33
-
34
-
35
-
36
-
37
-
38
-
39
-
40
-
41
-
42
-
43
-
44
-
45
-
46
-
47
-
48
 |
 |
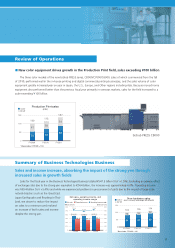
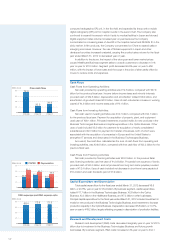
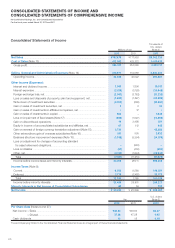
billion in the Business Technologies Business, decreased 1.1% to ¥10.2 billion in the
Optics Business, decreased 31.5% to ¥4.9 billion in the Healthcare Business, and
increased 10.8% to ¥13.1 billion in other businesses.
Financial Position and Liquidity
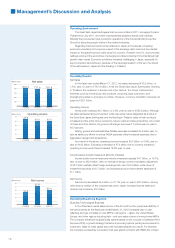
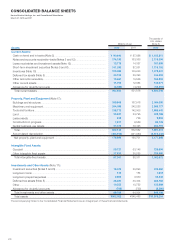
Assets
Current assets at March 31, 2012 increased ¥64.0 billion, or 12.8%, from a year
earlier to ¥565.9 billion. Cash on hand and in banks increased ¥2.7 billion, short-term
investment securities increased ¥5.4 billion, and notes and accounts receivable-trade
increased ¥10.8 billion. Deferred tax assets decreased ¥10.2 billion.
Property, plant and equipment as of March 31, 2012 decreased ¥11.7 billion from a
year earlier to ¥178.9 billion due to normal depreciation. Intangible assets decreased ¥1.0
billion from a year earlier to ¥87.3 billion due to amortization despite increased goodwill
as a result of business acquisitions in the Business Technologies Business.
Investments and other assets as of March 31, 2012 increased ¥5.2 billion from a
year earlier to ¥69.7 billion. Investment securities decreased ¥1.8 billion from a year
earlier largely because of reduced book value due to lower stock prices. However,
deferred tax assets increased ¥7.8 billion from a year earlier.
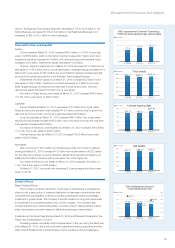
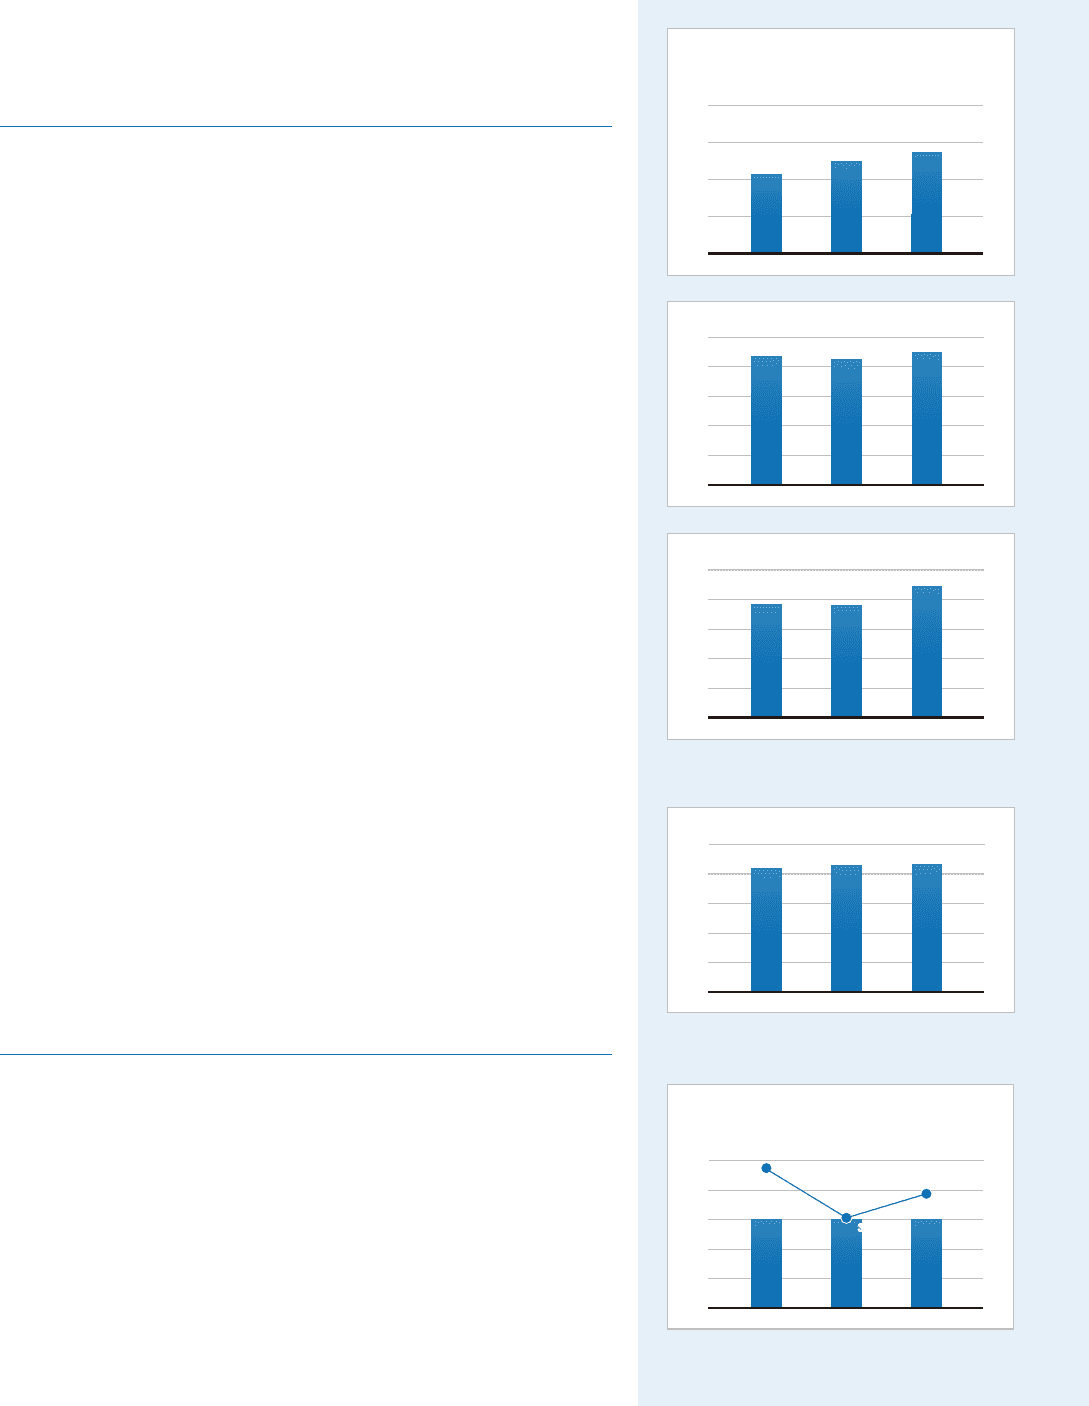
As a result of these factors, total assets at March 31, 2012 increased ¥56.5 billion,
or 6.7%, from a year earlier to ¥902.0 billion.
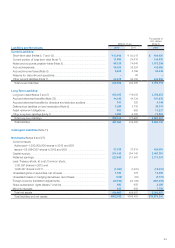
Liabilities
Current liabilities at March 31, 2012, decreased ¥13.5 billion from a year earlier.
Notes and accounts payable-trade increased ¥13.4 billion, while the total of short-term
debt and the current portion of long-term debt decreased ¥29.6 billion.
Long-term liabilities at March 31, 2012 increased ¥64.1 billion from a year earlier
because bonds payable increased ¥40.0 billion due to the issue of bonds and long-term
loans payable increased ¥24.9 billion.
As a result of the above, total liabilities as of March 31, 2012 increased ¥50.5 billion,
or 12.1%, from a year earlier to ¥467.0 billion.
Interest-bearing debt as of March 31, 2012 increased ¥35.3 billion from a year
earlier to ¥227.9 billion.
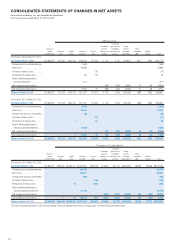
Net Assets
After net income of ¥20.4 billion and dividend payments of ¥7.9 billion, retained
earnings at March 31, 2012 increased ¥11.3 billion from a year earlier to ¥222.8 billion.
On the other hand, foreign currency translation adjustments reduced net assets by an
additional ¥6.0 billion compared with a year earlier due to the higher yen.
As a result of the above, net assets at March 31, 2012 increased ¥5.9 billion, or
1.4%, from a year earlier to ¥434.9 billion.
At March 31, 2012, the equity ratio decreased 2.5 percentage points from a year
earlier to 48.1%.
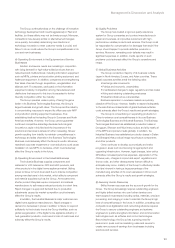
Dividend Policy
Basic Dividend Policy
The Company considers distribution of earnings to shareholders a management
priority under a basic policy of sustained distribution of earnings to shareholders after
comprehensive consideration of factors including consolidated results and strategic
investment in growth areas. The Company’s specifi c medium-to-long-term benchmark
for dividends is a consolidated payout ratio of 25% or higher. The Company also
considers factors such as fi nancial position and share price in making decisions about
share repurchases as another means of distributing earnings to shareholders.
Dividends for the Fiscal Year Ending March 31, 2012 and Planned Dividends for the
Fiscal Year Ending March 31, 2013
Increasing market competition and the appreciation of the yen during the fi scal year
ended March 31, 2012, along with production adjustments among customers and two
major natural disasters that impacted supply chains, created continued challenging
Management’s Discussion and Analysis
R&D expenses for Common Technology
Platforms and Leading-Edge Technologies
20
11.6 12.4 13.1
15
10
5
FY2009 FY2010 FY2011
0
(Billions of yen)
Total assets
1000 865.7 845.4 902.0
800
600
400
200
FY2009 FY2010 FY2011
0
(Billions of yen)
Interest-bearing debt
250
197.3 192.5
227.9
200
150
100
50
FY2009 FY2010 FY2011
0
(Billions of yen)
Net assets
500 420.7 428.9 434.9
400
300
200
100
FY2009 FY2010 FY2011
0
(Billions of yen)
Cash dividends per share and
consolidated payout ratio
25
15.00 15.00 15.00
20
15
10
5
FY2009 FY2010 FY2011
0
50
40
30
20
10
0
(Billions of yen) (%)
30.7%
30.7%
47.0%
39.9%
18