Konica Minolta 2006 Annual Report Download - page 52
Download and view the complete annual report
Please find page 52 of the 2006 Konica Minolta annual report below. You can navigate through the pages in the report by either clicking on the pages listed below, or by using the keyword search tool below to find specific information within the annual report.-
 1
1 -
2
-
3
-
4
-
5
-
6
-
7
-
8
-
9
-
10
-
11
-
12
-
13
-
14
-
15
-
16
-
17
-
18
-
19
-
20
-
21
-
22
-
23
-
24
-
25
-
26
-
27
-
28
-
29
-
30
-
31
-
32
-
33
-
34
-
35
-
36
-
37
-
38
-
39
-
40
-
41
-
 42
42 -
 43
43 -
 44
44 -
 45
45 -
 46
46 -
 47
47 -
 48
48 -
 49
49 -
 50
50 -
 51
51 -
 52
52 -
 53
53 -
 54
54 -
 55
55 -
 56
56 -
 57
57 -
 58
58
 |
 |

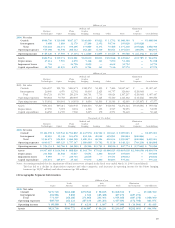
50
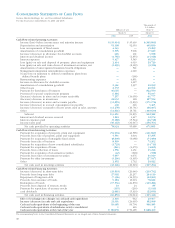
Millions of yen
North Asia Elimination
Japan America Europe and Other Total and Corporate Consolidation
2005: Net sales
Outside ¥480,522 ¥250,207 ¥278,164 ¥ 58,552 ¥1,067,447 ¥ — ¥1,067,447
Intersegment 313,852 8,565 1,624 145,636 469,679 (469,679) —
Total 794,375 258,773 279,789 204,188 1,537,127 (469,679) 1,067,447
Operating expenses 719,788 256,412 276,369 200,856 1,453,427 (453,557) 999,869
Operating income ¥ 74,587 ¥ 2,360 ¥ 3,419 ¥ 3,332 ¥ 83,699 ¥ (16,122) ¥ 67,577
Assets ¥819,494 ¥154,093 ¥158,021 ¥ 75,106 ¥1,206,715 ¥(251,173) ¥ 955,542
Thousands of U.S. dollars
North Asia Elimination
Japan America Europe and Other Total and Corporate Consolidation
2006: Net sales
Outside $4,058,228 $2,232,808 $2,303,277 $ 500,681 $ 9,095,003 $ — $9,095,003
Intersegment 2,507,755 50,209 11,084 1,579,024 4,148,089 (4,148,089) —
Total 6,565,991 2,283,017 2,314,361 2,079,714 13,243,092 (4,148,089) 9,095,003
Operating expenses 5,837,388 2,222,874 2,278,309 2,070,367 12,408,964 (4,024,057) 8,384,898
Operating income $ 728,595 $ 60,143 $ 36,052 $ 9,339 $ 834,128 $ (124,023) $ 710,096
Assets $6,995,539 $1,564,416 $1,233,396 $ 734,068 $10,527,428 $(2,490,874) $8,036,554
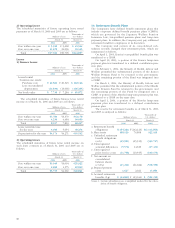
Note: Major countries or areas other than Japan are as follows:
North America ............U.S.A. and Canada
Europe ........................Germany, France and U.K.
Asia and Other ...........Australia, China and Singapore
Accounting standards for the impairment of fixed assets were adopted in the fiscal year ended March 31, 2006 (consolidated).
This has led to a decline in depreciation expenses and other categories. Operating income in Japan, North America, Europe, and Asia
and Others (excluding Japan) increased ¥1,840 million, ¥1,077 million, ¥64 million, and ¥35 million, respectively.
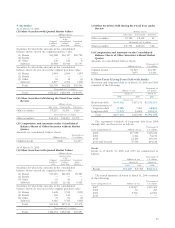
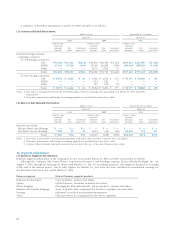
(3) Overseas Sales
Thousands of Percentage
Millions of yen U.S. dollars of net sales
2006: Sales to
North America ¥274,218 $2,334,366 25.7%
Europe 281,418 2,395,658 26.3
Asia and Other 199,529 1,698,553 18.7
2005: Sales to
North America ¥264,718 $2,465,015 24.8%
Europe 282,475 2,630,366 26.5
Asia and Other 213,435 1,987,476 20.0
Notes: 1. Major countries or areas are as follows:
North America ............U.S.A. and Canada
Europe ........................Germany, France and U.K.
Asia and Other ...........Australia, China and Singapore
2. “Overseas sales” represents sales recognized outside of Japan by the Companies.
17. Net Income per share
Caluculations of net income per share for the years ended March 31, 2006 and 2005, are as follows.
Thousands of
Millions of yen U.S. dollars
March 31 March 31
2006 2005 2006
Net income attributable to common shares (¥54,305) ¥7,491 ($462,288)
Weight average number of common shares outstanding:
Basic 530,898 531,017 530,898
Diluted — — —
Yen U.S. dollars
Net income per share:
Basic (¥102.29) 14.11 $0.87
Diluted — — —
The Company had no dilutive potential common shares for the year ended March 31, 2005.
Diluted net income per share for the ended March 31, 2006 is not disclosed due to the company’s loss position (anti-dilutive).