Konica Minolta 2006 Annual Report Download - page 15
Download and view the complete annual report
Please find page 15 of the 2006 Konica Minolta annual report below. You can navigate through the pages in the report by either clicking on the pages listed below, or by using the keyword search tool below to find specific information within the annual report.-
 1
1 -
2
-
3
-
4
-
 5
5 -
 6
6 -
 7
7 -
 8
8 -
 9
9 -
 10
10 -
 11
11 -
 12
12 -
 13
13 -
 14
14 -
 15
15 -
 16
16 -
 17
17 -
 18
18 -
 19
19 -
 20
20 -
 21
21 -
 22
22 -
 23
23 -
 24
24 -
 25
25 -
26
-
27
-
28
-
29
-
30
-
31
-
32
-
33
-
34
-
35
-
36
-
37
-
38
-
39
-
40
-
41
-
42
-
43
-
44
-
45
-
46
-
47
-
48
-
49
-
50
-
51
-
52
-
53
-
54
-
55
-
56
-
57
-
58
 |
 |
13
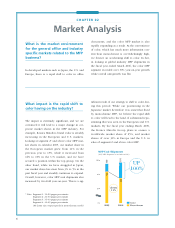
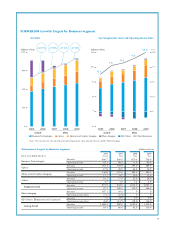
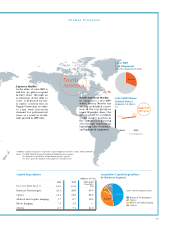
* Source: Gartner Dataquest “Quarterly Copier Shipment Statistics” (May 2006) GJ06305
Notes: (1) MFP: Multi-Function Peripherals (Multifunction copiers)
(2) Segments classified by monochrome printer speeds.
(3) Years given for market share graph are calendar years.
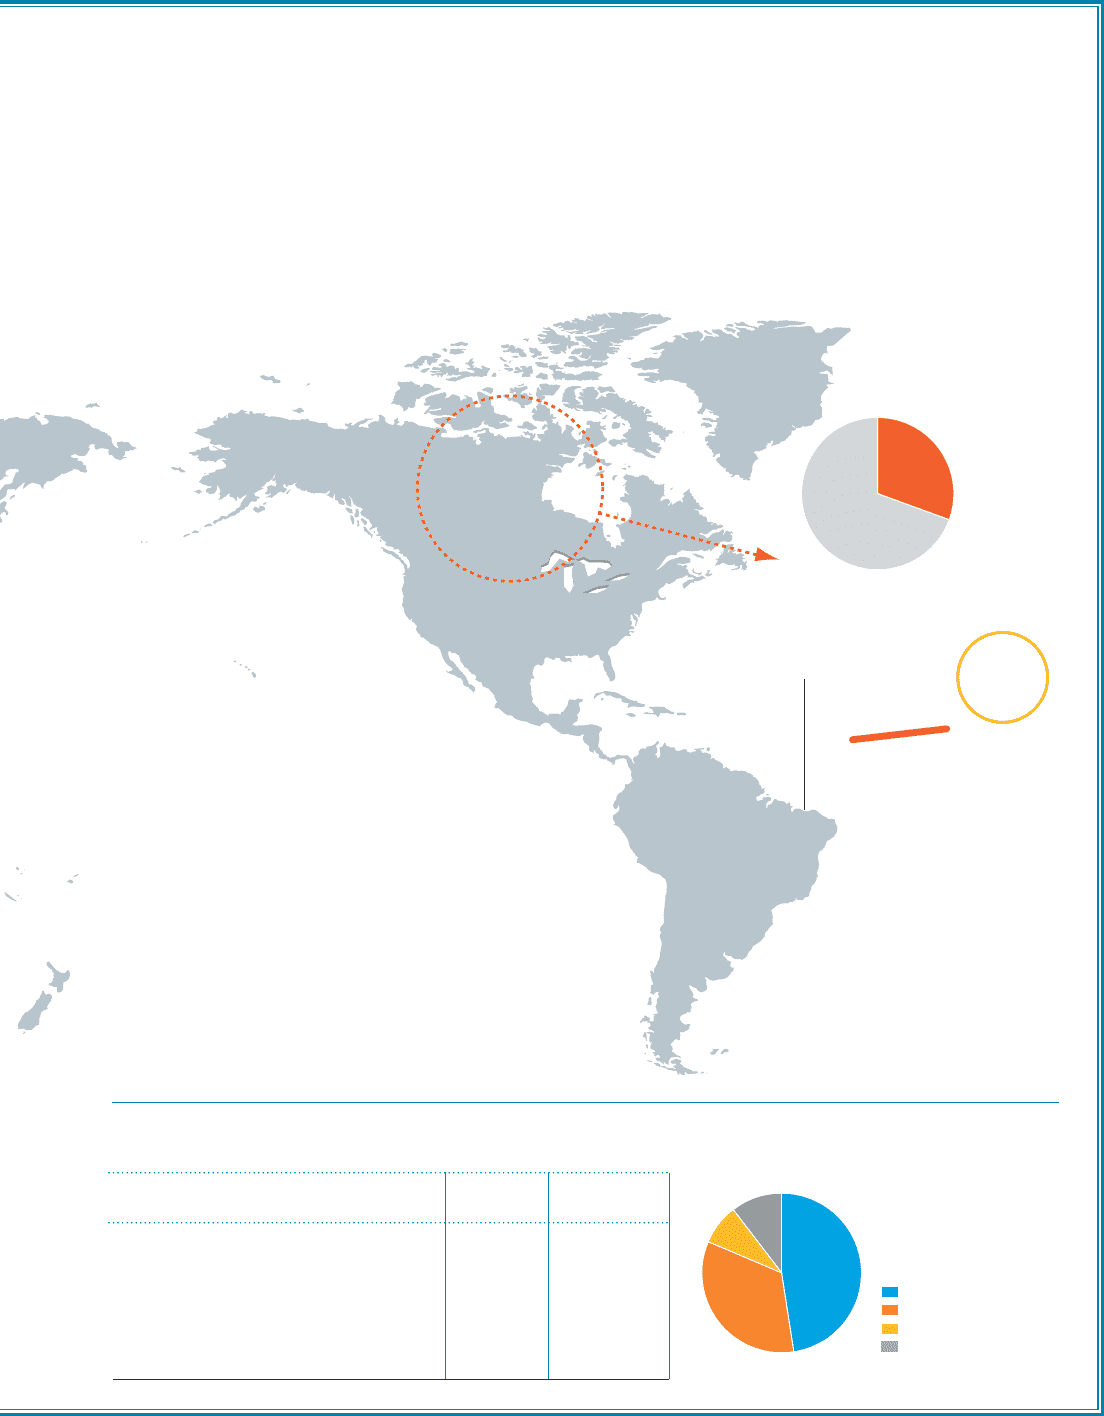
30.6%
20052004
Color MFP
Unit Shipments
(Fiscal Year Ended March 2006)
Color MFP Shares*
(United States)
(Segment 2 & above)
(%)
Unit Shipments
16.0
18.5
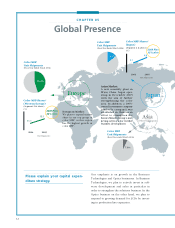
North
America
2009 Plan
30%-plus
North American Market:
In addition to color MFP
where Konica Minolta has
already established a posi-
tion in the top group in
terms of market share, the
Group plans to establish
asolid market position in
the commercial printing
area through emphasis on
expanding sales of medium-
and high-speed equipment.
Japanese Market:
As the share of color MFP is
still low, we plan to expand
market share through an
acceleration of the shift to
color. A dedicated factory
is under construction in
Nagano Prefecture in order
to cope with increased
demand for polymerized
toner as a result of world-
wide growth in MFP sales.
47.5%
33.8%
8.2%
10.4%
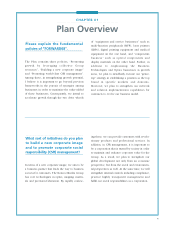
Cumulative Capital Expenditure
by Business Segment
(2007–2009 Cumulative Plan)
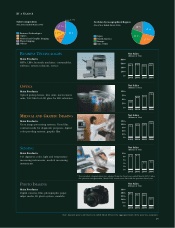
Business Technologies
Optics
Medical and Graphic Imaging
Others
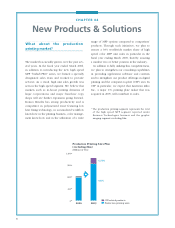
Business Technologies
Optics
Medical and Graphic Imaging
Photo Imaging
Others
2007–2009
Cumulative
Plan
95.5
68.0
16.5
—
21.0
2006
Actual
28.8
21.8
6.7
3.0
7.3
2005
Actual
24.3
14.4
3.7
7.4
6.7
Capital Expenditure
Fiscal Years Ended March 31
(Billions of Yen)
Global Presence