Konica Minolta 2006 Annual Report Download - page 30
Download and view the complete annual report
Please find page 30 of the 2006 Konica Minolta annual report below. You can navigate through the pages in the report by either clicking on the pages listed below, or by using the keyword search tool below to find specific information within the annual report.-
 1
1 -
2
-
3
-
4
-
5
-
6
-
7
-
8
-
9
-
10
-
11
-
12
-
13
-
14
-
15
-
16
-
17
-
18
-
19
-
 20
20 -
 21
21 -
 22
22 -
 23
23 -
 24
24 -
 25
25 -
 26
26 -
 27
27 -
 28
28 -
 29
29 -
 30
30 -
 31
31 -
 32
32 -
 33
33 -
 34
34 -
 35
35 -
 36
36 -
 37
37 -
 38
38 -
 39
39 -
 40
40 -
41
-
42
-
43
-
44
-
45
-
46
-
47
-
48
-
49
-
50
-
51
-
52
-
53
-
54
-
55
-
56
-
57
-
58
 |
 |
28
CONSOLIDATED FINANCIAL REVIEW
Scope of Consolidated Financial Statements
The Konica Minolta Group comprises Konica Minolta
Holdings, Inc. and its 124 subsidiaries, 30 unconsolidated
subsidiaries and 11 affiliated companies.
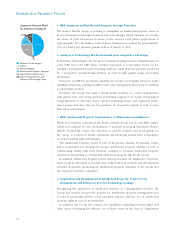
The business segments of the Group are organized
and segmented by type of product and the markets in
which these products are sold. These five segments are:
Business Technologies, Optics, Photo Imaging, Medical
and Graphic Imaging and Other Businesses.
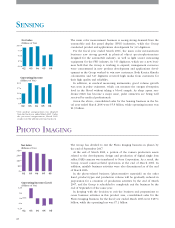
In addition, the Group decided to exit the Photo
Imaging business in stages by the end of September 2007.
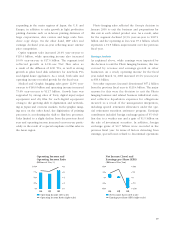
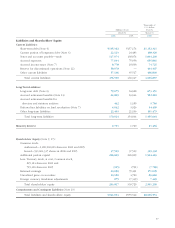
Consolidated Business Results
Consolidated Net Sales
Consolidated sales for the fiscal year ended March 31,
2006 reflected the decision to exit the Photo Imaging
business and increased ¥0.9 billion over the previous fis-
cal year to ¥1,068.4 billion. However, strong business
performance was recorded in the main three business
segments of Business Technologies, Optics and Medical
and Graphics Imaging, which recorded an increase of
¥77.3 billion over the previous fiscal year.
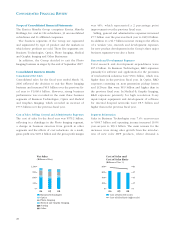
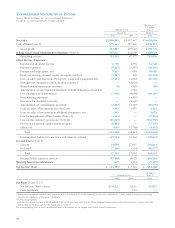
Cost of Sales, Selling, General and Administrative Expenses
The cost of sales for the fiscal year was ¥575.2 billion,
reflecting in a shrinkage in the Photo Imaging segment,
a change in business structure from growth in other
segments and the effects of cost reductions. As a result,
gross profit was ¥493.2 billion and the gross profit margin
was 46%, which represented a 2 percentage point
improvement over the previous fiscal year.
Selling, general and administrative expenses increased
¥7.7 billion over the previous fiscal year to ¥409.8 billion.
In addition to a ¥6.7 billion increase owing to the effects
of a weaker yen, research and development expenses
for new product development in the Group’s three major
business segments were also a factor.
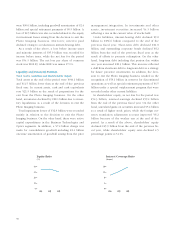
Research and Development Expenses
Total research and development expenditures were
¥67.2 billion. In Business Technologies, R&D expenses
primarily for software and applications for the provision
of total network solutions were ¥38.1 billion, which was
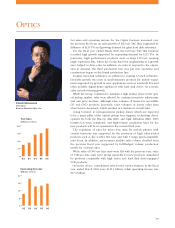
higher than in the previous fiscal year. In Optics, R&D
expenses centering on next generation pickup lenses
and LCD-use film were ¥8.9 billion and higher than in
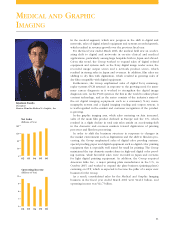
the previous fiscal year. In Medical & Graphic Imaging,
R&D expenses primarily for high resolution X-ray
input/output equipment and development of software
for internal hospital networks were ¥8.5 billion and
higher than in the previous fiscal year.
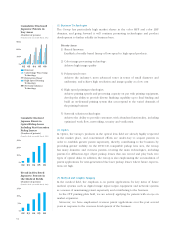
Segment Information
Sales in Business Technologies rose 7.4% year-on-year
to ¥606.7 billion and operating income increased 16.6%
year-on-year to ¥65.1 billion. The main reasons for the
increases were strong sales growth from the introduc-
tion of new color MFP products, where demand is
04 05 06
0
200
400
600
800
0
15
30
45
60
Cost of Sales (left scale)
Cost of Sales Ratio (right scale)
Cost of Sales and
Cost of Sales Ratio
(Billions of Yen, %)
04 05 06
0
300
600
900
Business Technologies
Optics
Photo Imaging
Medical and Graphic Imaging
Sensing
Other
Net Sales
(Billions of Yen)
1,200