Konica Minolta 2006 Annual Report Download - page 11
Download and view the complete annual report
Please find page 11 of the 2006 Konica Minolta annual report below. You can navigate through the pages in the report by either clicking on the pages listed below, or by using the keyword search tool below to find specific information within the annual report.-
 1
1 -
 2
2 -
 3
3 -
 4
4 -
 5
5 -
 6
6 -
 7
7 -
 8
8 -
 9
9 -
 10
10 -
 11
11 -
 12
12 -
 13
13 -
 14
14 -
 15
15 -
 16
16 -
 17
17 -
 18
18 -
 19
19 -
 20
20 -
 21
21 -
 22
22 -
23
-
24
-
25
-
26
-
27
-
28
-
29
-
30
-
31
-
32
-
33
-
34
-
35
-
36
-
37
-
38
-
39
-
40
-
41
-
42
-
43
-
44
-
45
-
46
-
47
-
48
-
49
-
50
-
51
-
52
-
53
-
54
-
55
-
56
-
57
-
58
 |
 |
9
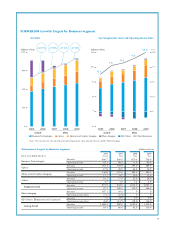
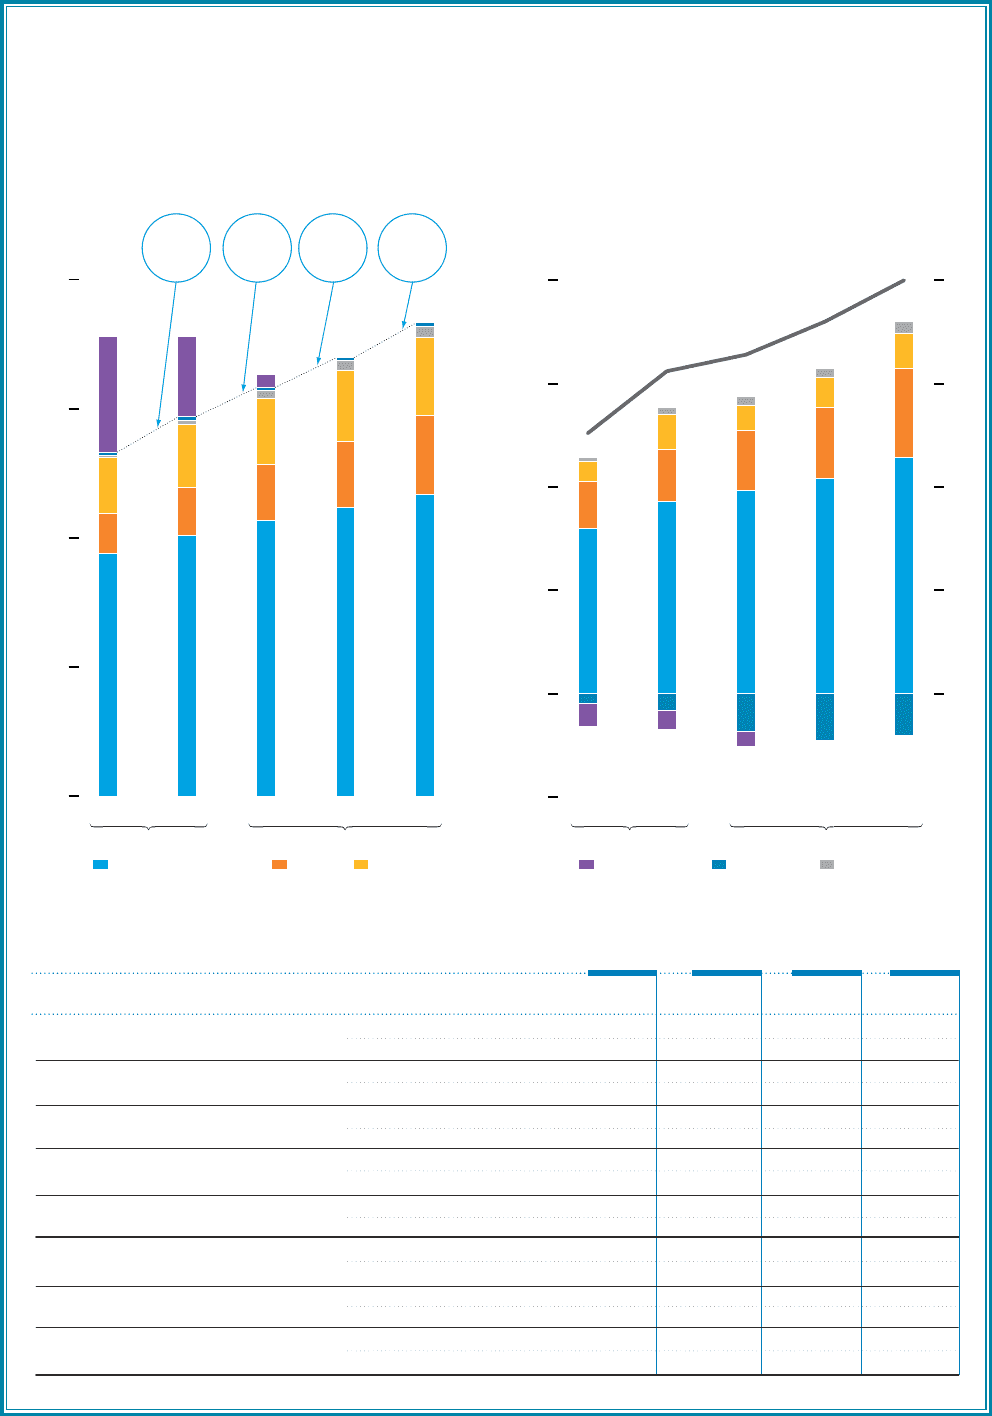
Net Sales
Operating Income (Loss) and Operating Income Ratio
20062005 2007 2008 2009 20062005 2007 2008 2009
Business Technologies Optics Medical and Graphic Imaging Photo Imaging HD Others Other Businesses
-35
0
35
70
105
140
0
300
600
900
1,200
0
2.5
5.0
7.5
10.0
+10.3% +7.8% +7.4% +7.8%
(Billions of Yen) (Billions of Yen) (%)
Actual PlanActual Plan
6.3
7.8 8.2
9.0
10.0
FORWARD08 Growth Targets by Business Segment
Fiscal Years Ended March 31
Net sales
Operating income
Net sales
Operating income
Net sales
Operating income
Net sales
Operating income
Net sales
Operating income
Net sales
Operating income (loss)
Net sales
Operating income (loss)
Net sales
Operating income
2009
Plan
Business Technologies
Optics
Medical and Graphic Imaging
Others
Segment Total
Photo Imaging
HD Others, Elimination and Corporate
Group Total
700.0
80.0
185.0
30.0
180.0
12.0
26.0
4.0
1,091.0
126.0
0
0
9.0
(16.0)
1,100.0
110.0
2008
Plan
670.0
73.0
155.0
24.0
165.0
10.0
22.0
3.2
1,012.0
110.0
0
0
8.0
(18.2)
1,020.0
92.0
2007
Plan
640.0
69.0
130.0
20.0
155.0
8.5
17.0
3.0
942.0
100.5
30.0
(6.0)
8.0
(14.5)
980.0
80.0
2006
Actual
606.7
65.1
110.4
17.6
146.6
11.7
10.2
2.7
873.9
97.1
187.1
(7.1)
7.4
(6.6)
1,068.4
83.4
Performance Targets by Business Segment (Billions of Yen)
Note: Year-on-year net sales growth and operating income ratio amounts do not include Photo Imaging.