Konica Minolta 2006 Annual Report Download - page 17
Download and view the complete annual report
Please find page 17 of the 2006 Konica Minolta annual report below. You can navigate through the pages in the report by either clicking on the pages listed below, or by using the keyword search tool below to find specific information within the annual report.-
 1
1 -
2
-
3
-
4
-
5
-
6
-
 7
7 -
 8
8 -
 9
9 -
 10
10 -
 11
11 -
 12
12 -
 13
13 -
 14
14 -
 15
15 -
 16
16 -
 17
17 -
 18
18 -
 19
19 -
 20
20 -
 21
21 -
 22
22 -
 23
23 -
 24
24 -
 25
25 -
 26
26 -
 27
27 -
28
-
29
-
30
-
31
-
32
-
33
-
34
-
35
-
36
-
37
-
38
-
39
-
40
-
41
-
42
-
43
-
44
-
45
-
46
-
47
-
48
-
49
-
50
-
51
-
52
-
53
-
54
-
55
-
56
-
57
-
58
 |
 |
15
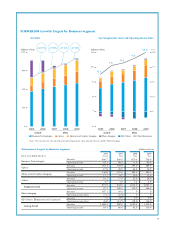
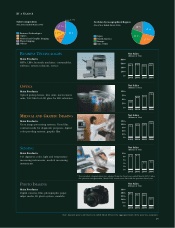
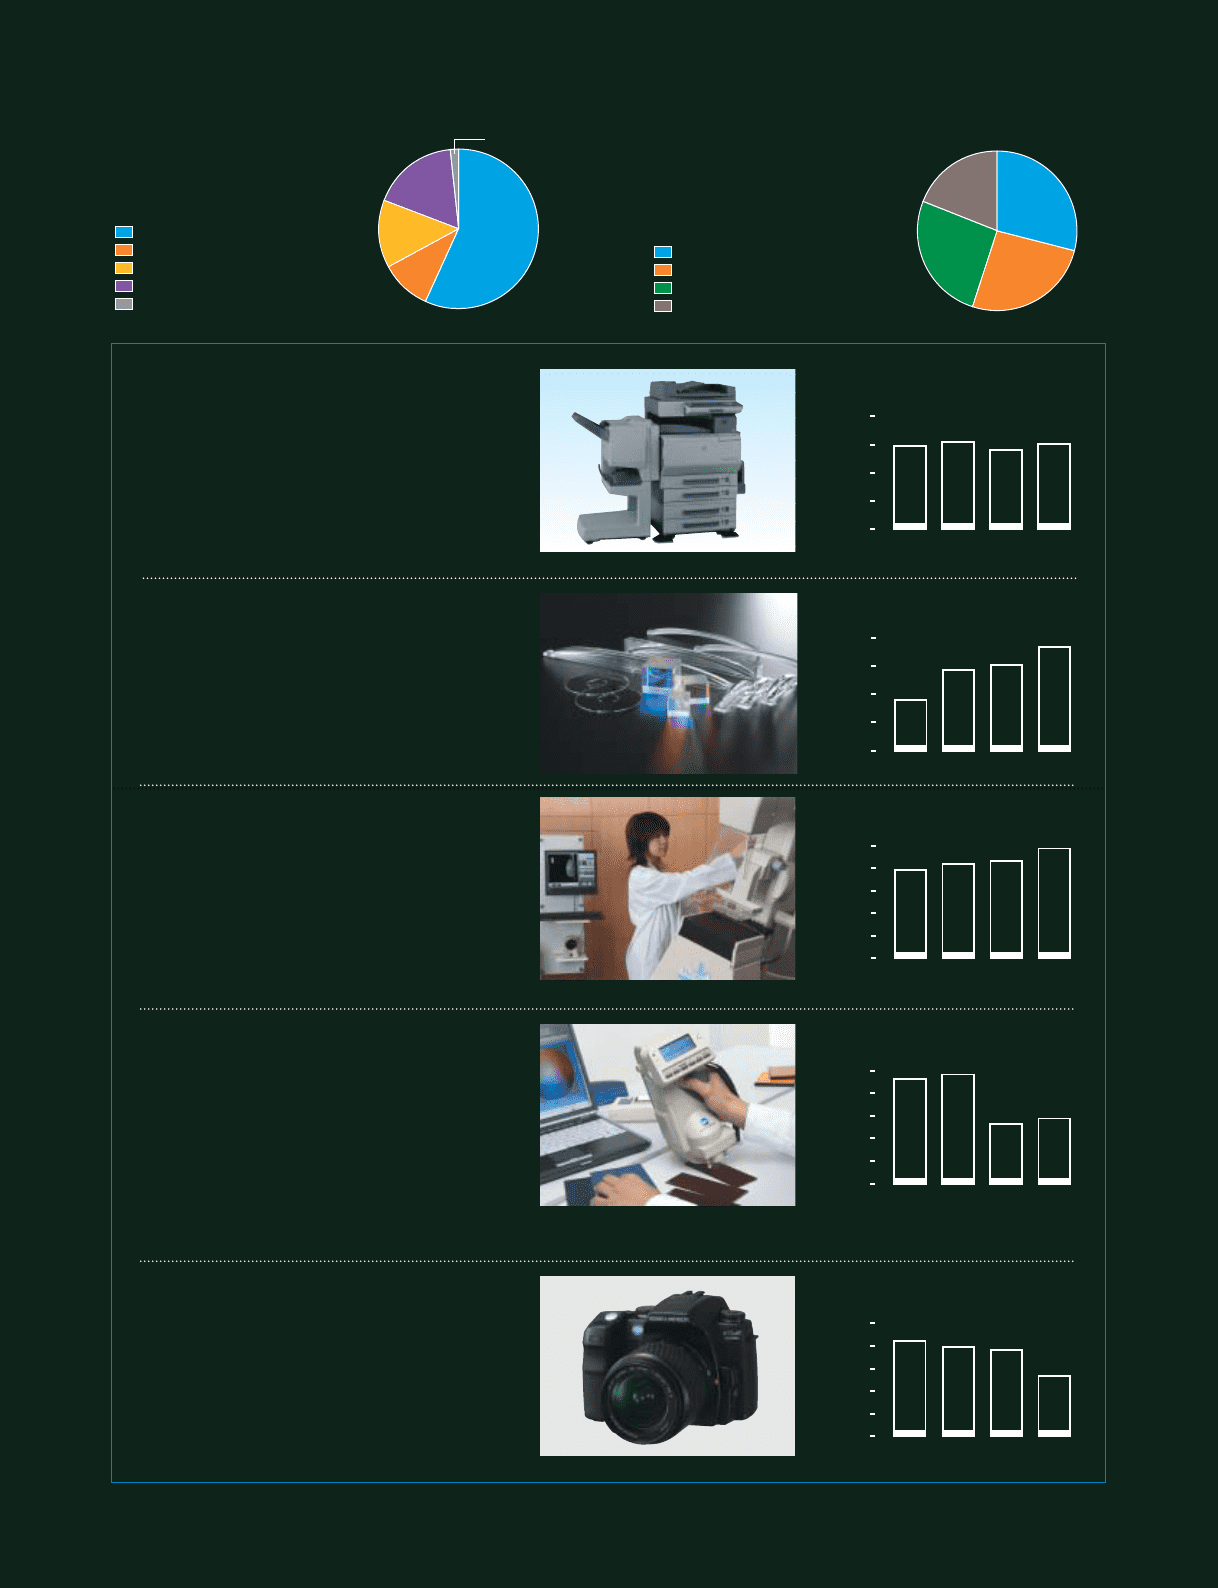
ATAGLANCE
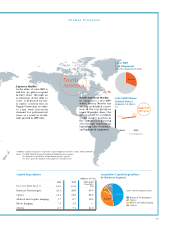
56.8%
10.3%
13.7%
17.5%
1.7%
Sales Composition
(Fiscal Year Ended March 2006)
Business Technologies
Optics
Medical and Graphic Imaging
Photo Imaging
Others
Net Sales by Geographical Region
Japan
North America
Europe
Asia, Other
29.3%
26.3%
25.7%
18.7%
(Fiscal Year Ended March 2006)
BUSINESS TECHNOLOGIES
Main Products:
MFPs, LBPs, facsimile machines, consumables,
software, system solutions, service.
OPTICS
Main Products:
Optical pickup lenses, lens units, microcamera
units, TAC film for LCD glass for HD substrates.
PHOTO IMAGING
Main Products:
Digital cameras, film, photographic paper,
inkjet media, ID photo system, minilabs.
Note: Amounts prior to the fiscal year ended March 2004 are the aggregated totals of the prior two companies.
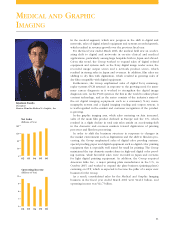
MEDICAL AND GRAPHIC IMAGING
Main Products:
X-ray image processing systems, X-ray film,
contrast media for diagnostic purposes, digital
color proofing systems, graphic film.
* New product categorization was adopted from the fiscal year ended March 2005. Under
the previous categorization, March 2005 results were flat with the previous fiscal year.
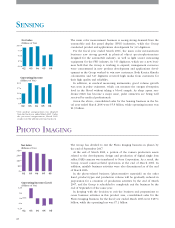
SENSING
Main Products:
3-D digitizers; color, light and temperature
measuring instruments, medical measuring
instruments.
2003 2004 2005 2006
Net Sales
(Billions of Yen)
564.8 606.7
618.9
594.5
0
200
400
600
800
2003 2004 2005 2006
Net Sales
(Billions of Yen)
91.7
110.4
86.0
54.0
0
30
60
90
120
2003 2004 2005 2006
Net Sales
(Billions of Yen)
129.9
146.6
125.6
117.4
0
30
60
90
120
150
2003 2004 2005 2006
Net Sales
(Billions of Yen)
5.3 5.8
9.7
9.3
0
2
4
6
8
10
2003 2004 2005 2006
Net Sales
(Billions of Yen)
268.5
187.1
278.3
297.3
0
70
140
210
280
350