Konica Minolta 2006 Annual Report Download - page 51
Download and view the complete annual report
Please find page 51 of the 2006 Konica Minolta annual report below. You can navigate through the pages in the report by either clicking on the pages listed below, or by using the keyword search tool below to find specific information within the annual report.-
 1
1 -
2
-
3
-
4
-
5
-
6
-
7
-
8
-
9
-
10
-
11
-
12
-
13
-
14
-
15
-
16
-
17
-
18
-
19
-
20
-
21
-
22
-
23
-
24
-
25
-
26
-
27
-
28
-
29
-
30
-
31
-
32
-
33
-
34
-
35
-
36
-
37
-
38
-
39
-
40
-
 41
41 -
 42
42 -
 43
43 -
 44
44 -
 45
45 -
 46
46 -
 47
47 -
 48
48 -
 49
49 -
 50
50 -
 51
51 -
 52
52 -
 53
53 -
 54
54 -
 55
55 -
 56
56 -
 57
57 -
 58
58
 |
 |
49
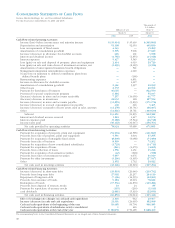
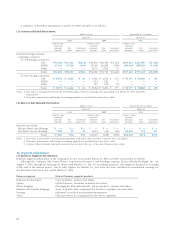
Millions of yen
Medical and Elimination
Business Photo Graphic and
Technologies Optics Imaging Imaging Sensing Other Total Corporate Consolidation
2006: Net sales
Outside ¥606,730 ¥110,368 ¥187,117 ¥ 146,600 ¥5,822 ¥ 11,752 ¥1,068,390 ¥ — ¥1,068,390
Intersegment 3,488 1,803 12,179 27,269 2,352 58,734 105,828 (105,828) —
Total 610,218 112,171 199,296 173,869 8,174 70,486 1,174,218 (105,828) 1,068,390
Operating expenses 545,098 94,578 206,412 162,180 6,319 60,041 1,074,630 (89,655) 984,974
Operating income ¥65,120 ¥ 17,593 ¥ (7,115) ¥ 11,689 ¥1,855 ¥ 10,445 ¥ 99,588 ¥ (16,172) ¥ 83,415
Assets ¥462,534 ¥119,174 ¥102,061 ¥ 122,610 ¥8,813 ¥430,648 ¥1,245,842 (301,787) ¥ 944,054
Depreciation 27,214 7,593 4,070 5,128 141 7,050 51,198 — 51,198
Impairment losses 704 — 24,756 2,659 — 4,632 32,752 — 32,752
Capital expenditure 28,765 21,835 2,975 6,704 141 7,146 67,570 — 67,570
Millions of yen
Medical and Elimination
Business Photo Graphic and
Technologies Optics Imaging Imaging Sensing Other Total Corporate Consolidation
2005: Net sales
Outside ¥564,837 ¥91,705 ¥268,471 ¥129,872 ¥5,293 ¥ 7,266 ¥1,067,447 ¥ — ¥1,067,447
Intersegment 29,886 4,079 12,782 19,918 2,425 60,757 129,849 (129,849) —
Total 594,724 95,785 281,253 149,791 7,719 68,024 1,197,297 (129,849) 1,067,447
Operating expenses 538,892 79,783 289,905 143,134 6,125 56,490 1,114,332 (114,462) 999,869
Operating income ¥ 55,832 ¥16,001 ¥ (8,651) ¥ 6,656 ¥1,593 ¥ 11,533 ¥ 82,965 ¥ (15,387) ¥ 67,577
Assets ¥451,381 ¥95,214 ¥169,545 ¥103,963 ¥7,817 ¥443,501 ¥1,271,424 ¥(315,881) ¥ 955,542
Depreciation 27,359 5,672 8,904 4,366 133 6,517 52,953 — 52,953
Capital expenditure 24,258 14,378 7,366 3,695 178 6,571 56,448 — 56,448
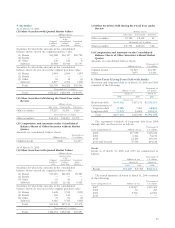
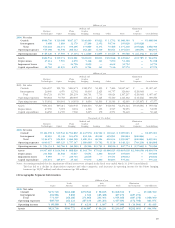
Thousands of U.S. dollars
Medical and Elimination
Business Photo Graphic and
Technologies Optics Imaging Imaging Sensing Other Total Corporate Consolidation
2006: Net sales
Outside $5,164,978 $ 939,542 $1,592,892 $1,247,978 $ 49,562 $ 100,043 $ 9,095,003 $ — $9,095,003
Intersegment 29,693 15,349 103,678 232,136 20,022 499,991 900,894 (900,894) —
Total 5,194,671 954,891 1,696,569 1,480,114 69,584 600,034 9,995,897 (900,894) 9,095,003
Operating expenses 4,640,317 805,125 1,757,147 1,380,608 53,792 511,118 9,148,123 (763,216) 8,384,898
Operating income $554,354 $ 149,766 $ (60,569) $ 99,506 $15,791 $ 88,916 $ 847,774 $ (137,669) $ 710,096
Assets $3,937,465 $1,014,506 $ 868,826 $1,043,756 $ 75,023 $3,666,025 $10,605,618 $(2,569,056) $8,036,554
Depreciation 231,668 64,638 34,647 43,654 1,200 60,015 435,839 — 435,839
Impairment losses 5,993 — 210,743 22,636 — 39,431 278,812 — 278,812
Capital expenditure 244,871 185,877 25,326 57,070 1,200 60,833 575,211 — 575,211
Notes: Accounting standards for the impairment of fixed assets were adopted in the fiscal year ended March 31, 2006 (consolidated).
This has led to a decline in depreciation expenses and other categories, and increases in operating income for the Photo Imaging
business (up ¥2,997 million) and other business (up ¥20 million).
(2) Geographic Segment Information
Millions of yen
North Asia Elimination
Japan America Europe and Other Total and Corporate Consolidation
2006: Net sales
Outside ¥476,720 ¥262,288 ¥270,566 ¥ 58,815 ¥1,068,390 ¥ — ¥1,068,390
Intersegment 294,586 5,898 1,302 185,488 487,276 (487,276) —
Total 771,307 268,186 271,868 244,304 1,555,666 (487,276) 1,068,390
Operating expenses 685,718 261,121 267,633 243,206 1,457,681 (472,706) 984,974
Operating income ¥ 85,588 ¥ 7,065 ¥ 4,235 ¥ 1,097 ¥ 97,985 ¥ (14,569) ¥ 83,415
Assets ¥821,766 ¥183,772 ¥144,887 ¥ 86,231 ¥1,236,657 ¥(292,603) ¥ 944,054