Konica Minolta 2006 Annual Report Download - page 31
Download and view the complete annual report
Please find page 31 of the 2006 Konica Minolta annual report below. You can navigate through the pages in the report by either clicking on the pages listed below, or by using the keyword search tool below to find specific information within the annual report.-
 1
1 -
2
-
3
-
4
-
5
-
6
-
7
-
8
-
9
-
10
-
11
-
12
-
13
-
14
-
15
-
16
-
17
-
18
-
19
-
20
-
 21
21 -
 22
22 -
 23
23 -
 24
24 -
 25
25 -
 26
26 -
 27
27 -
 28
28 -
 29
29 -
 30
30 -
 31
31 -
 32
32 -
 33
33 -
 34
34 -
 35
35 -
 36
36 -
 37
37 -
 38
38 -
 39
39 -
 40
40 -
 41
41 -
42
-
43
-
44
-
45
-
46
-
47
-
48
-
49
-
50
-
51
-
52
-
53
-
54
-
55
-
56
-
57
-
58
 |
 |

29
04 05 06
0
25
50
75
100
0
2
4
6
8
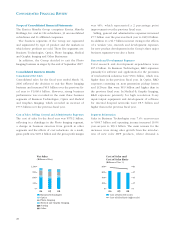
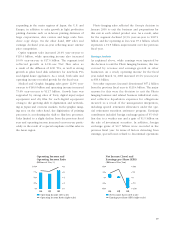
Operating Income (left scale)
Operating Income Ratio (right scale)
Operating Income and
Operating Income Ratio
(Billions of Yen, %)
04 05 06
-60
-30
0
30
60
-100
-50
0
50
100
Net Income (Loss) (left scale)
Earnings per Share (EPS) (right scale)
Net Income (Loss) and
Earnings per Share (EPS)
(Billions of Yen, Yen)
expanding in the major regions of Japan, the U.S. and
Europe, in addition to sales growth in light production
printing domains such as in-house printing divisions of
large corporations, data centers and large scale fran-
chise copy shops. On the other hand, LBP sales and
earnings declined year-on-year reflecting more intense
price competition.
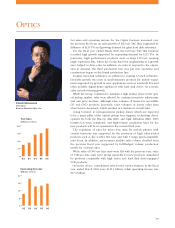
Optics segment sales increased 20.4% year-on-year to
¥110.4 billion, while operating income also increased
10.0% year-on-year to ¥17.6 billion. The segment total
reflected growth in LCD-use TAC film sales as
a result of the diffusion of LCD TVs, as well as strong
growth in glass hard disk substrates for notebook PCs
and digital home appliances. As a result, both sales and
operating income recorded growth for the fiscal year.
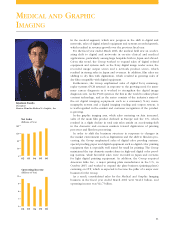
Medical and Graphic Imaging sales grew 12.9% year-
on-year to ¥146.6 billion and operating income increased
75.6% year-on-year to ¥11.7 billion. Growth here was
supported by strong sales of X-ray digital input/output
equipment and dry film for such digital equipment
owing to the growing shift to digitization and network-
ing in Japan and overseas markets. In the graphic imag-
ing area on the other hand, the digitization of printing
processes is accelerating the shift to film-less processes.
Sales limited to a slight decline from the previous fiscal
year and operating income increased year-on-year partic-
ularly as the result of a special emphasis on film sales in
the Asian region.
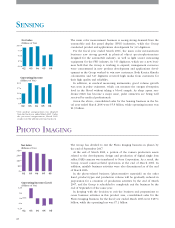
Photo Imaging sales reflected the Group’s decision in
January 2006 to exit the business and preparations for
this exit in each related product area. As a result, sales
for the segment declined 30.3% year-on-year to ¥187.1
billion and the operating in loss was ¥7.1 billion, which
represents a ¥1.5 billion improvement over the previous
fiscal year.
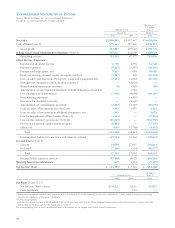
Earnings Analysis
As explained above, while earnings were impacted by
the decision to exit the Photo Imaging business, this was
covered by revenue and earnings growth in other
businesses. As a result, operating income for the fiscal
year ended March 31, 2006 increased 23.4% year-on-year
to ¥83.4 billion.
Net other expenses (income) deteriorated ¥87.2 billion
from the previous fiscal year to ¥119.4 billion. The major
reasons for this were the decision to exit the Photo
Imaging business and related business withdrawal costs,
and collective liquidation expenses for obligations
incurred as a result of the management integration,
including special retirement allowances under the spe-
cial retirement transition assistance program. Earnings
contributors included foreign exchange gains of ¥5.4 bil-
lion due to a weaker yen and a gain of ¥1.5 billion on
the sale of investment securities. In addition, foreign
exchange gains of ¥0.7 billion were recorded in the
previous fiscal year. In terms of factors detracting from
earnings, special losses related to discontinud operations