Konica Minolta 2006 Annual Report Download - page 45
Download and view the complete annual report
Please find page 45 of the 2006 Konica Minolta annual report below. You can navigate through the pages in the report by either clicking on the pages listed below, or by using the keyword search tool below to find specific information within the annual report.-
 1
1 -
2
-
3
-
4
-
5
-
6
-
7
-
8
-
9
-
10
-
11
-
12
-
13
-
14
-
15
-
16
-
17
-
18
-
19
-
20
-
21
-
22
-
23
-
24
-
25
-
26
-
27
-
28
-
29
-
30
-
31
-
32
-
33
-
34
-
 35
35 -
 36
36 -
 37
37 -
 38
38 -
 39
39 -
 40
40 -
 41
41 -
 42
42 -
 43
43 -
 44
44 -
 45
45 -
 46
46 -
 47
47 -
 48
48 -
 49
49 -
 50
50 -
 51
51 -
 52
52 -
 53
53 -
 54
54 -
 55
55 -
56
-
57
-
58
 |
 |
43
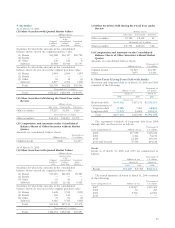
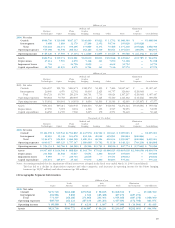
5. Securities
As of March 31, 2006
(1) Other Securities with Quoted Market Values
Millions of yen
Market value
at the
Original consolidated Unrealized
purchase balance gains
value sheet date (losses)
Securities for which the amounts in the consolidated
balance sheets exceed the original purchase value
(1) Shares ¥13,688 ¥30,417 ¥16,728
(2) Bonds — — —
(3) Other 120 129 8
Subtotal 13,808 30,546 16,737
Securities for which the amounts in the consolidated
balance sheets do not exceed the original purchase value
(1) Shares 2,881 2,694 (187)
(2) Bonds — — —
(3) Other 16 12 (3)
Subtotal 2,897 2,706 (191)
Total ¥16,706 ¥33,252 ¥16,546
Thousands of U.S. dollars
Total $142,215 $283,068 $140,853
(2) Other Securities Sold during the Fiscal Year under
Review
Millions of yen
Sale value Total profit Total loss
Other securities ¥5,215 ¥1,531 ¥420
Thousands of U.S. dollars
Other securities $44,394 $13,033 $3,575
(3) Composition and Amounts on the Consolidated
Balance Sheets of Other Securities without Market
Quotes
Amounts on consolidated balance sheets
Thousands of
Millions of yen U.S. dollars
Unlisted stocks ¥486 $4,137
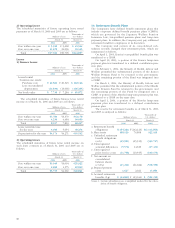
As of March 31, 2005
(1) Other Securities with Quoted Market Values
Millions of yen
Market value
at the
Original consolidated Unrealized
purchase balance gains
value sheet date (losses)
Securities for which the amounts in the consolidated
balance sheets exceed the original purchase value
(1) Shares ¥13,010 ¥21,391 ¥8,381
(2) Bonds — — —
(3) Other 19 20 1
Subtotal 13,029 21,412 8,382
Securities for which the amounts in the consolidated
balance sheets do not exceed the original purchase value
(1) Shares 6,428 5,519 (909)
(2) Bonds 116 116 —
(3) Other 70 69 (0)
Subtotal 6,616 5,706 (909)
Total ¥19,645 ¥27,119 ¥7,473
Thousands of U.S. dollars
Total $182,931 $252,528 $69,587
(2) Other Securities Sold during the Fiscal Year under
Review
Millions of yen
Sale value Total profit Total loss
Other securities ¥5,128 ¥2,461 ¥3
Thousands of U.S. dollars
Other securities $47,751 $22,916 $28
(3) Composition and Amounts on the Consolidated
Balance Sheets of Other Securities without Market
Quotes
Amounts on consolidated balance sheets
Thousands of
Millions of yen U.S. dollars
Unlisted stocks ¥1,545 $14,387
Other ¥155 $1,443
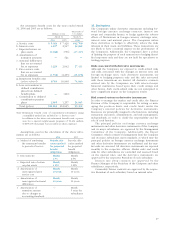
6. Short-Term & Long-Term Debt with Banks
Short-term and long-term debt as of March 31, 2006 and 2005
consisted of the following:
Thousands of
Millions of yen U.S. dollars
March 31 March 31
2006 2005 2006
(Interest rate)
Short-term debt ¥135,362 ¥157,174 $1,152,311
Current portion of
long-term debt 8,086 7,261 68,835
Long-term debt 74,045 54,604 630,331
Total ¥217,494 ¥219,040 $1,851,485
The repayment schedule of long-term debt from 2008
through 2011 and beyond is as follows:
Thousands of
Years ending March 31 Millions of yen U.S. dollars
2008 ¥17,058 $145,212
2009 6,364 54,176
2010 12,103 103,031
2011 and beyond 27,503 234,128
Bonds
Bonds as of March 31, 2006 and 2005 are summarized as
follows:
Thousands of
Millions of yen U.S. dollars
March 31 March 31
2006 2005 2006
Bonds ¥19,067 ¥27,305 $162,314
The annual maturities of bonds at March 31, 2006 consisted
of the following:
Thousands of
Years ending March 31 Millions of yen U.S. dollars
2007 ¥14,037 $119,494
2008 30 255
2009 5,000 42,564
2010 — —