Konica Minolta 2004 Annual Report Download - page 56
Download and view the complete annual report
Please find page 56 of the 2004 Konica Minolta annual report below. You can navigate through the pages in the report by either clicking on the pages listed below, or by using the keyword search tool below to find specific information within the annual report.-
 1
1 -
2
-
3
-
4
-
5
-
6
-
7
-
8
-
9
-
10
-
11
-
12
-
13
-
14
-
15
-
16
-
17
-
18
-
19
-
20
-
21
-
22
-
23
-
24
-
25
-
26
-
27
-
28
-
29
-
30
-
31
-
32
-
33
-
34
-
35
-
36
-
37
-
38
-
39
-
40
-
41
-
42
-
43
-
44
-
45
-
 46
46 -
 47
47 -
 48
48 -
 49
49 -
 50
50 -
 51
51 -
 52
52 -
 53
53 -
 54
54 -
 55
55 -
 56
56 -
 57
57 -
 58
58 -
 59
59 -
 60
60 -
 61
61 -
 62
62
 |
 |

54
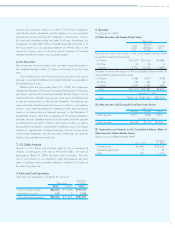
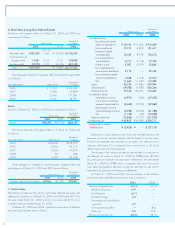
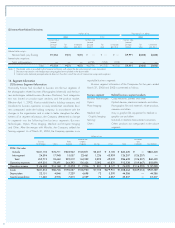
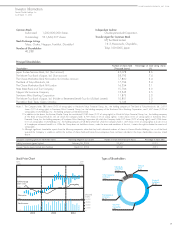
(2) Geographic Segment Information
Millions of yen
North Asia Eliminations
Japan America Europe and Other Total and Corporate Consolidation
2004: Net sales
Outside ¥405,787 ¥215,554 ¥190,178 ¥ 48,901 ¥ 860,420 ¥ — ¥860,420
Intersegment 223,931 9,678 2,069 95,247 330,928 (330,928) —
Total 629,719 225,233 192,247 144,148 1,191,348 (330,928) 860,420
Operating expenses 565,964 220,802 187,730 139,638 1,114,136 (311,245) 802,890
Operating income ¥ 63,754 ¥ 4,430 ¥ 4,517 ¥ 4,510 ¥ 77,212 ¥ (19,682) ¥ 57,530
Assets ¥835,472 ¥148,317 ¥146,841 ¥ 66,459 ¥1,197,091 ¥(227,501) ¥969,589
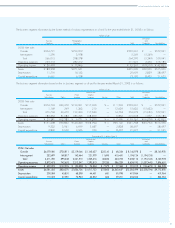
Millions of yen
North Asia Eliminations
Japan America Europe and Other Total and Corporate Consolidation
2003: Net sales
Outside ¥323,524 ¥124,964 ¥83,474 ¥27,077 ¥559,041 ¥ — ¥559,041
Intersegment 121,857 8,424 674 41,243 172,200 (172,200) —
Total 445,382 133,388 84,148 68,321 731,241 (172,200) 559,041
Operating expenses 401,412 128,325 82,644 66,508 678,890 (162,705) 516,185
Operating income ¥ 43,969 ¥ 5,063 ¥ 1,504 ¥ 1,813 ¥ 52,350 ¥ (9,495) ¥ 42,855
Assets ¥340,141 ¥ 83,806 ¥60,770 ¥22,810 ¥507,528 ¥ 8,427 ¥515,956
Thousands of U.S. dollars (Note 3)
North Asia Eliminations
Japan America Europe and Other Total and Corporate Consolidation
2004: Net sales
Outside $3,839,408 $2,039,493 $1,799,394 $ 462,683 $ 8,140,978 $ — $8,140,978
Intersegment 2,118,753 91,570 19,576 901,192 3,131,119 (3,131,119) —
Total 5,958,170 2,131,072 1,818,971 1,363,875 11,272,098 (3,131,119) 8,140,978
Operating expenses 5,354,944 2,089,148 1,776,232 1,321,204 10,541,546 (2,944,886) 7,596,651
Operating income $ 603,217 $ 41,915 $ 42,738 $ 42,672 $ 730,552 $ (186,224) $ 544,328
Assets $7,904,930 $1,403,321 $1,389,356 $ 628,811 $11,326,436 $(2,152,531) $9,173,895
Note: Major countries or areas other than Japan are as follows:
North America..........U.S.A. and Canada
Europe ....................Germany, France and U.K.
Asia and Other .........Australia, China and Singapore
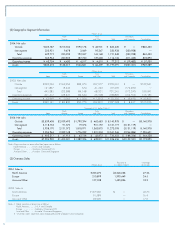
(3) Overseas Sales
Thousands of Percentage
Millions of yen U.S. dollars (Note 3) of net sales
2004: Sales to
North America ¥235,270 $2,226,038 27.3%
Europe 210,899 1,995,449 24.5
Asia and Other 157,038 1,485,836 18.3
2003: Sales to
North America ¥137,930 $ — 24.7%
Europe 91,589 — 16.4
Asia and Other 94,990 — 17.0
Notes:1. Major countries or areas are as follows:
North America..........U.S.A. and Canada
Europe ....................Germany, France and U.K.
Asia and Other .........Australia, China and Singapore
2. “Overseas sales” represents sales recognized outside of Japan by the Companies.